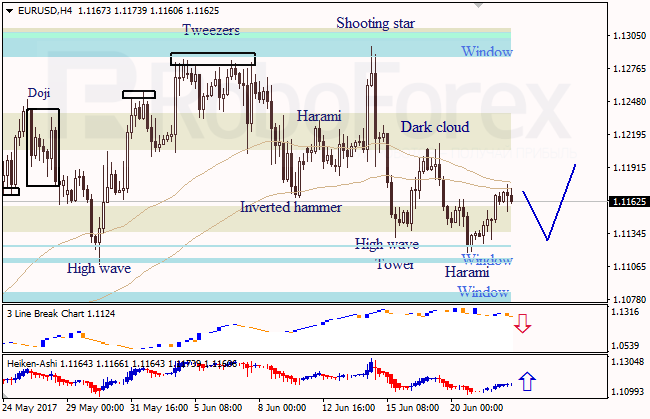
EUR USD, “Euro vs. US Dollar”
At the H4 chart of EUR USD, bullish Harami pattern indicated an ascending movement. The Window in the middle provided support. Three Line Break chart shows a bearish direction; Heiken Ashi candlesticks confirm the ascending movement.
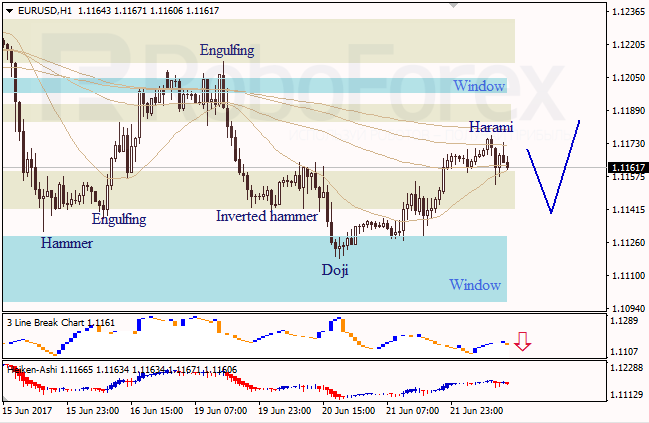
At the H1 chart of EUR USD, bearish Harami pattern indicates a descending correction. The downside Window provided support. Three Line Break chart and Heiken Ashi candlesticks confirm a bearish direction.
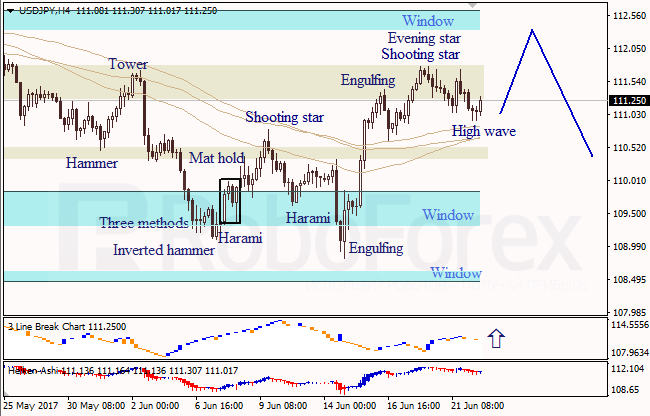
USD JPY, “US Dollar vs. Japanese Yen”
At the H4 chart of USD JPY, bullish High Wave pattern indicates an ascending movement. The upside Window is a resistance level. Three Line Break chart and Heiken Ashi candlesticks confirm a bullish direction.
RoboForex Analytical Department