XAUUSD, “Gold vs US Dollar”
As we can see in the H4 chart, the pair is finishing the correction within the rising tendency. After forming another Hammer pattern not far from the support area, XAUUSD may reverse and move towards the next upside target at the resistance area at 1945.00. At the same time, an opposite scenario implies that the price may start another decline with the target at 1900.00 before resuming the uptrend.


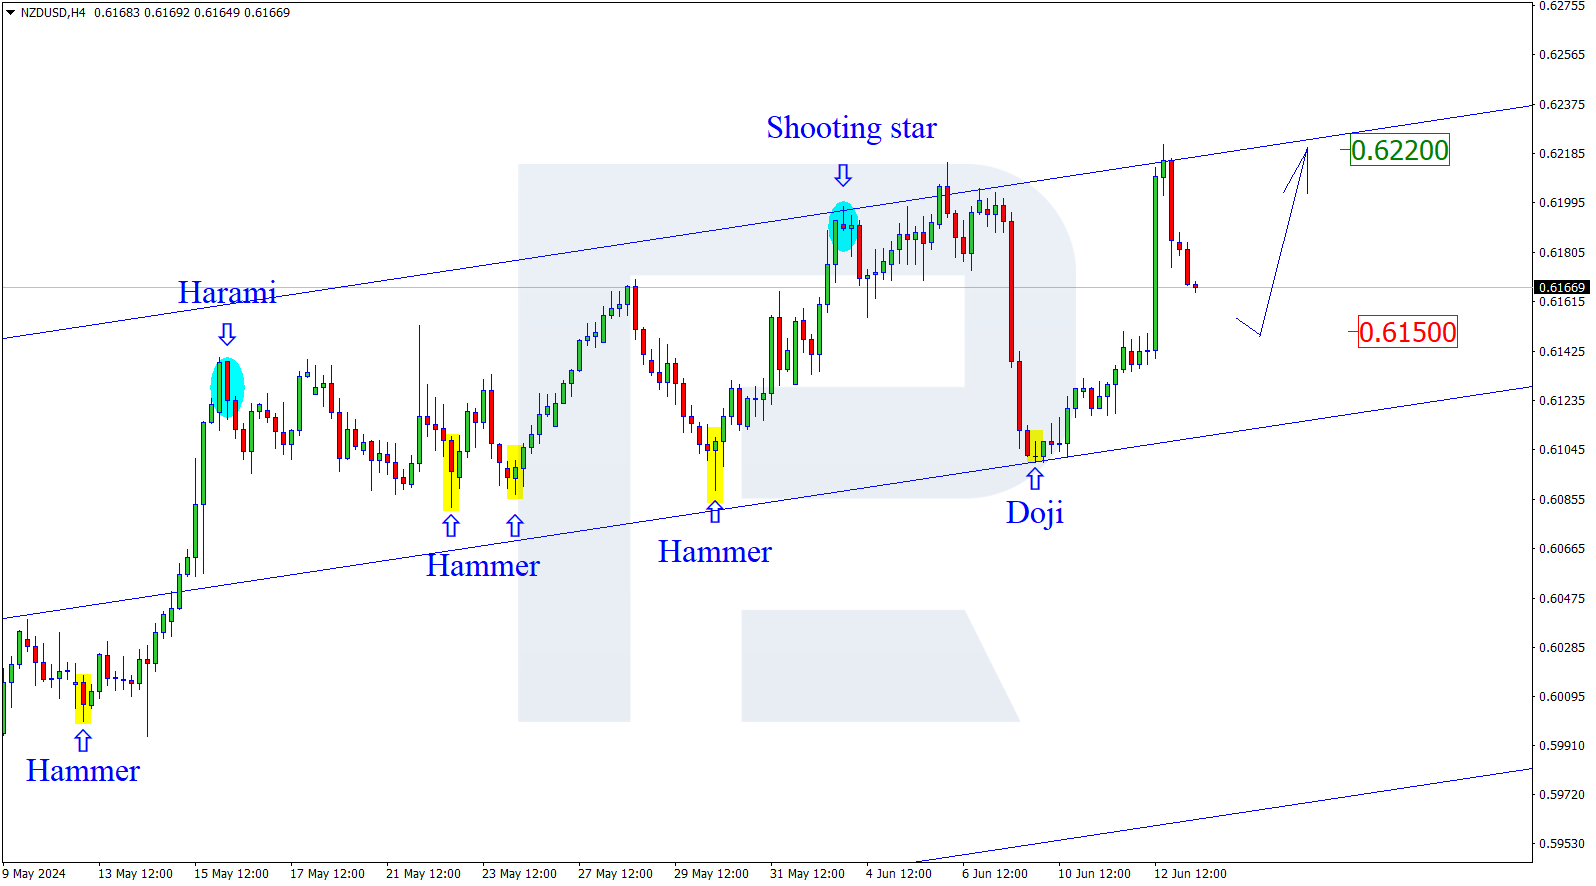
NZDUSD, “New Zealand vs. US Dollar”
As we can see in the H4 chart, the correction continues. After forming several reversal patterns, such as Harami, at the top of the correction, NZDUSD may reverse and resume moving downwards. The next downside target may be the support area at 0.6515. Still, an alternative scenario says that the pair may continue trading upwards to reach 0.6710 before resuming the descending tendency.
GBPUSD, “Great Britain Pound vs US Dollar”
As we can see in the H4 chart, the uptrend continues. By now, GBPUSD has formed several reversal patterns, such as Harami, not far from the support area. At the moment, the pair is reversing and may correct to reach the target at 1.3000. However, there might be another scenario, according to which the price may continue growing towards 1.3220 without reversing and correcting.
