EURUSD, “Euro vs US Dollar”
As we can see in the H4 chart, the asset has formed a Harami reversal pattern close to the resistance level. At the moment, EURUSD may reverse and form a new descending impulse. In this case, the downside correctional target may be at 1.1310. However, an alternative scenario implies that the price may grow to reach 1.1380 and continue its ascending tendency without testing the support area.


USDJPY, “US Dollar vs Japanese Yen”
As we can see in the H4 chart, USDJPY has formed several reversal patterns, for example, Harami, not far from the resistance area. At the moment, USDJPY may reverse and start a new correctional wave to the downside towards the support level. In this case, the downside target may be at 113.85. At the same time, an opposite scenario implies that the price may continue growing to reach 114.70 without correcting towards the support level.

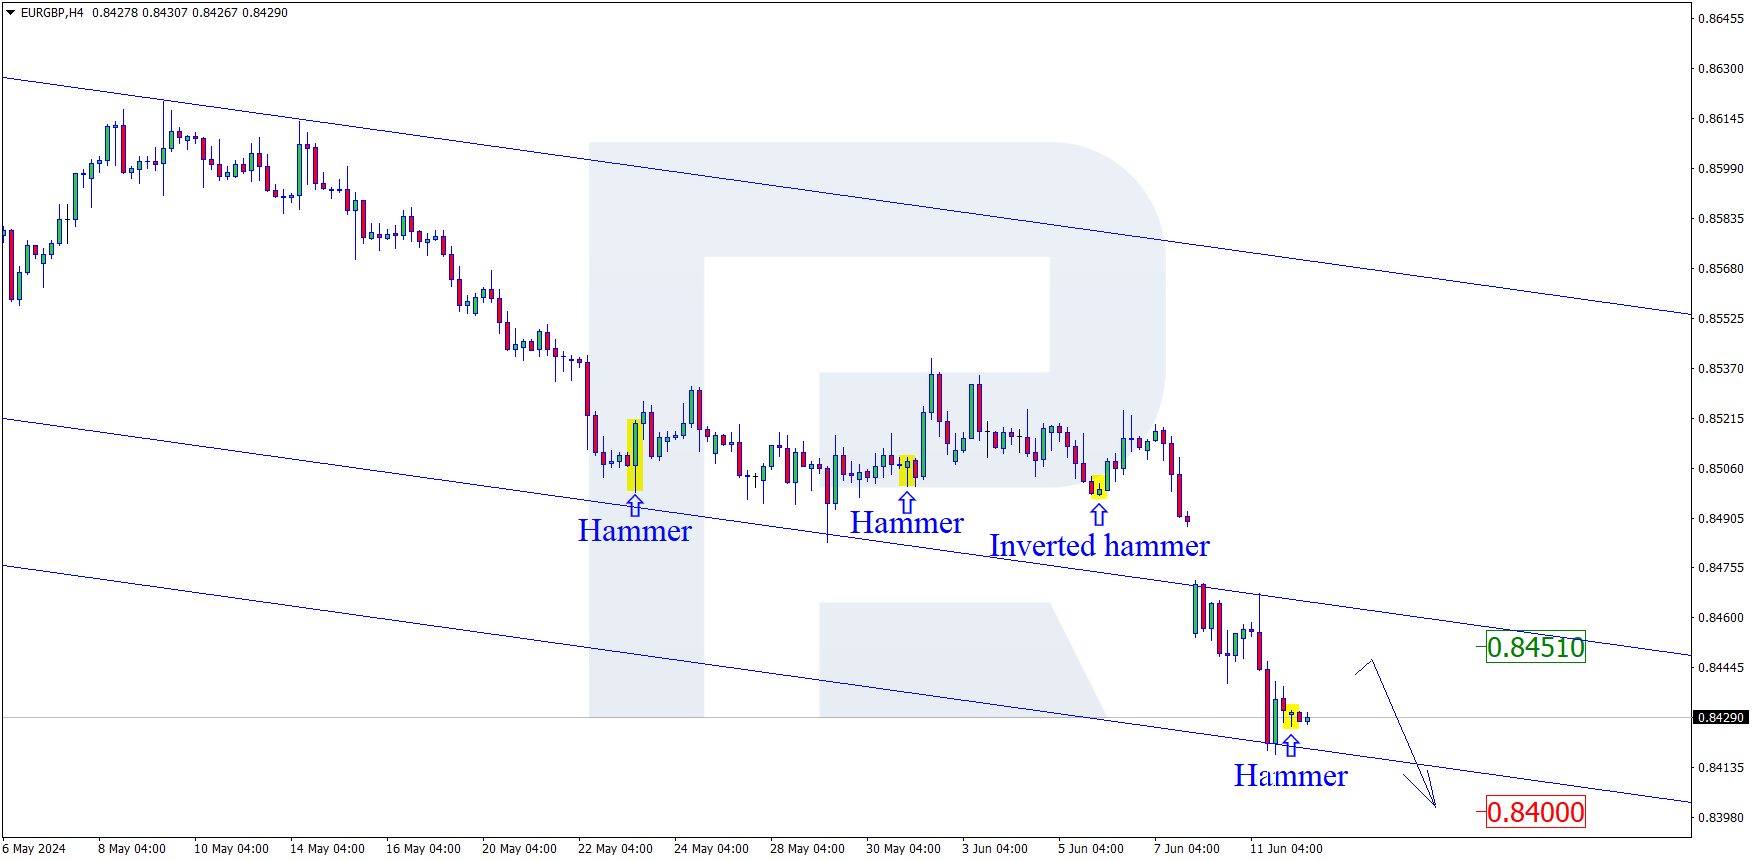
EURGBP, “Euro vs Great Britain Pound”
As we can see in the H4 chart, after forming an Inverted Hammer reversal pattern near the support level, EURGBP is reversing and may start another growth towards the next resistance area. In this case, the upside target may be at 0.8550. Later, the market may test the area, break it, and continue the ascending tendency. Still, there might be an alternative scenario, according to which the asset may correct to reach 0.8465 before resuming its movement to the upside.