EUR USD, “Euro vs. US Dollar”
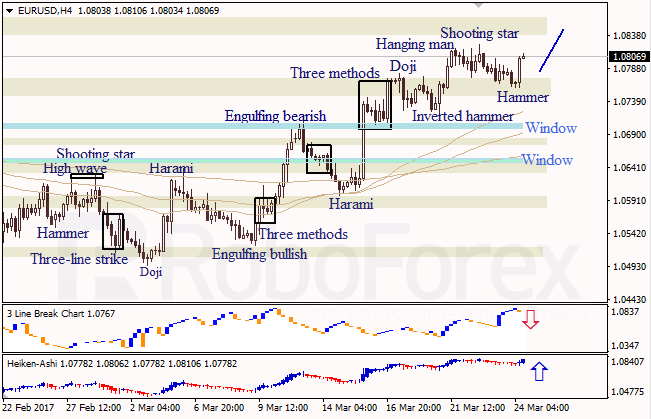
At the H4 chart of EUR USD, bullish Hammer pattern indicates an ascending movement. Three Line Break chart shows a bearish direction; Heiken Ashi candlesticks confirm the ascending movement.
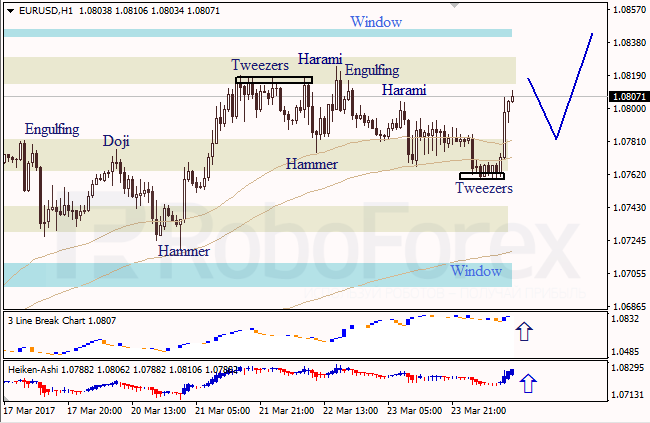
At the H1 chart of EUR USD, bullish Tweezers pattern indicated that the correction completed and the ascending tendency continues. Three Line Break chart and Heiken Ashi candlesticks confirm a bullish direction.
USD JPY, “US Dollar vs. Japanese Yen”
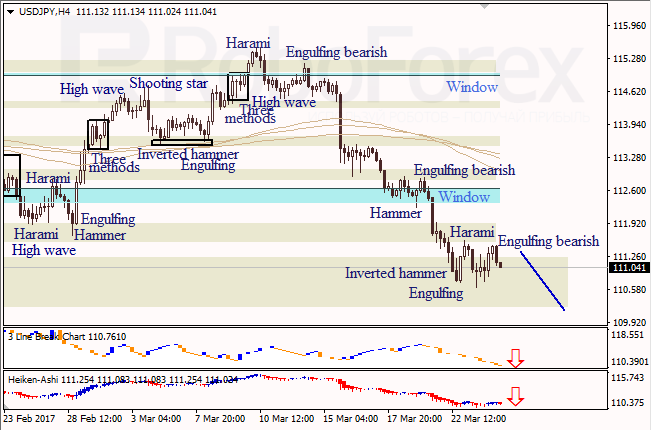
At the H4 chart of USD JPY, Engulfing Bearish and Harami patterns indicate a descending movement. Three Line Break chart and Heiken Ashi candlesticks confirm a bearish direction.
RoboForex Analytical Department