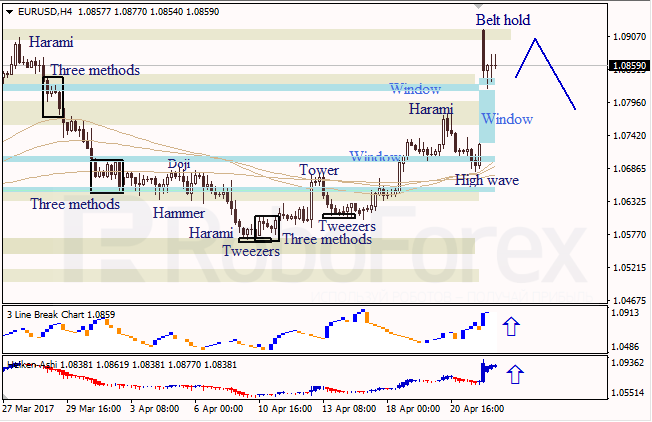
EUR USD, “Euro vs. US Dollar”
At the H4 chart of EUR USD, a new Window to the upside was opened. Bearish Belt Hold pattern indicates a descending movement. The upside Window is a support level. Three Line Break chart and Heiken Ashi candlesticks confirm a bullish direction.
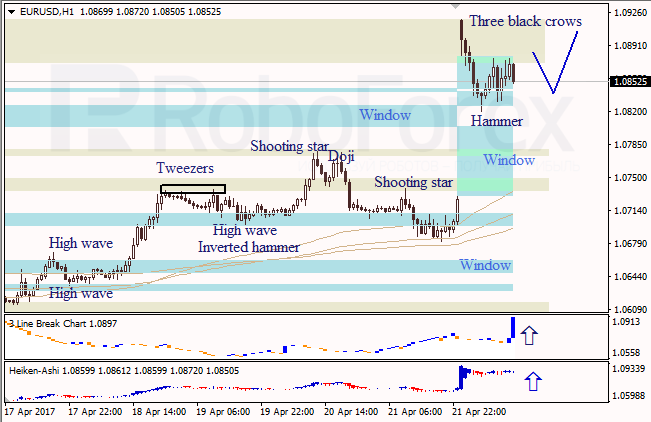
At the H1 chart of EUR USD, bearish Three Black Crows pattern shows a descending correction. The Window in the middle is a support level. Three Line Break chart and Heiken Ashi candlesticks confirm a bullish direction.
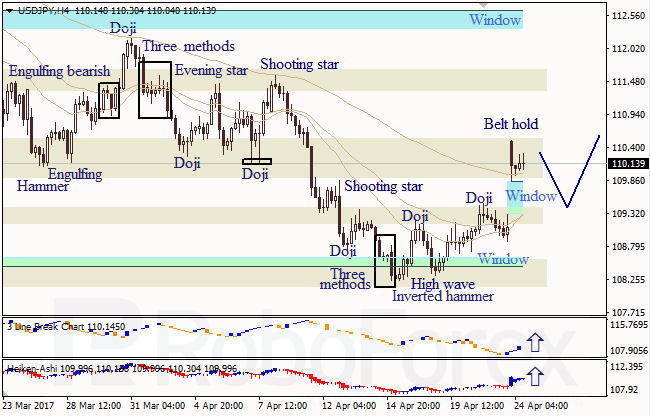
USD JPY, “US Dollar vs. Japanese Yen”
At the H4 chart of USD JPY, bearish Belt Hold pattern indicates a descending movement. The closest Window is a support level. Three Line Break chart and Heiken Ashi candlesticks confirm a bullish direction.
RoboForex Analytical Department