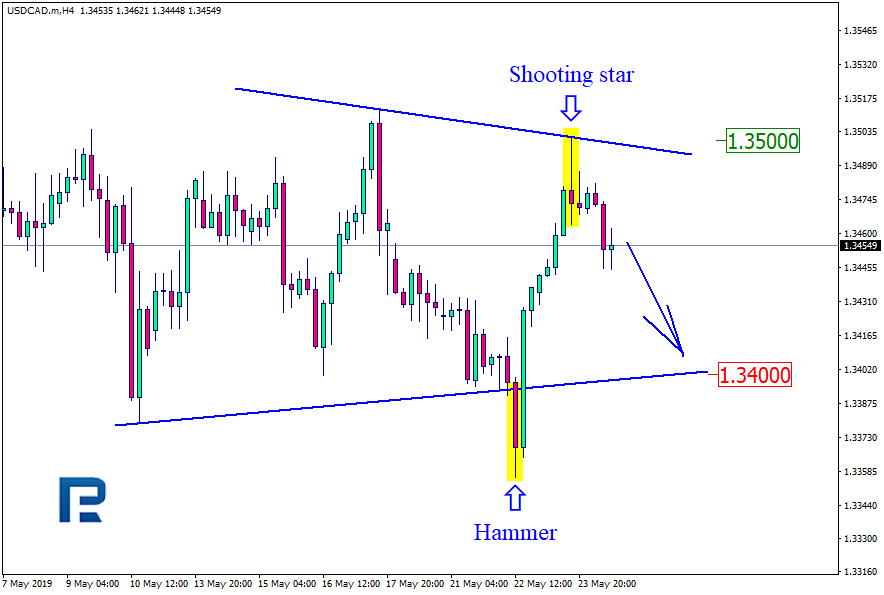
USD CAD, “US Dollar vs Canadian Dollar”
At the H4 chart, the USD/CAD pair continues growing and forming the ascending channel with Long-Legged Doji, Hammer, Doji, Harami, and Engulfing reversal patterns at support and resistance levels to define its borders. After finishing another pullback and forming Engulfing pattern, the price reached the resistance level at 1.2455 and broke it. Then the instrument formed Harami pattern and continued growing. The upside target is the next resistance level at 1.2621.
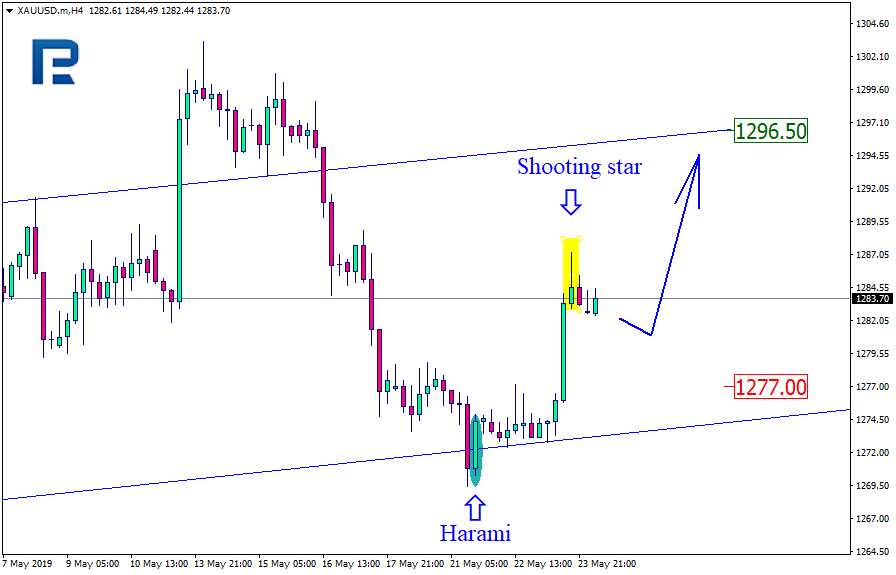
XAU USD, “Gold vs US Dollar”
As we can see at the H4 chart, the instrument continues forming the descending channel with Gap, Engulfing, Shooting Star, Doji, Hammer, and Inverted Hammer patterns to define its borders. The price reached the support level, broke it, paused for a while, and then continued falling to reach the next support level at 1271.00.
RoboForex Analytical Department