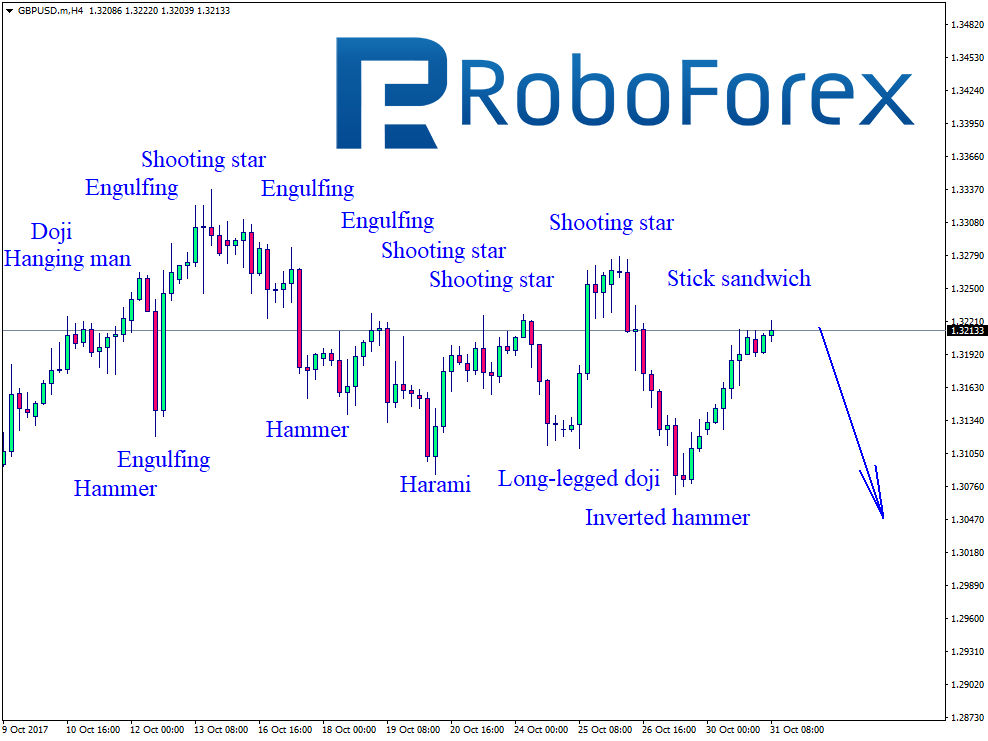
GBP USD, “Great Britain Pound vs US Dollar”
At the H4 chart of GBP USD, the price is still falling and constantly forming Doji, Engulfing, and Shooting Star reversal patterns during pullbacks. After finishing another pretty serious correction, the pair formed Engulfing, Belt Hold, and Harami patterns. Right now, the pair is moving sideways and has already formed another Harami and Hanging Man patterns. The downside target is still at the support level at 1.2861.
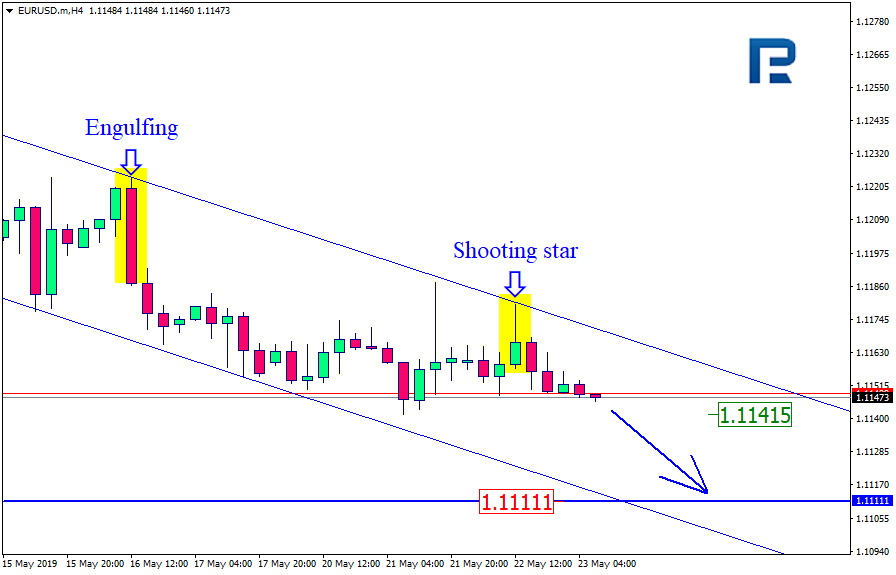
EUR USD, “Euro vs. US Dollar”
While moving sideways for some time, the EUR/USD pair formed Harami, Hammer, Long-Legged Doji, Engulfing, and Shooting Star reversal patterns at support and resistance levels, which made it difficult for traders to predict where it was going to move in the future. After some significant growth, the price once again formed Engulfing, Harami, and Doji patterns at the top, fell a little bit and formed one more Harami pattern. At the moment, the instrument continues moving downwards with the target at the support level at 1.1795.
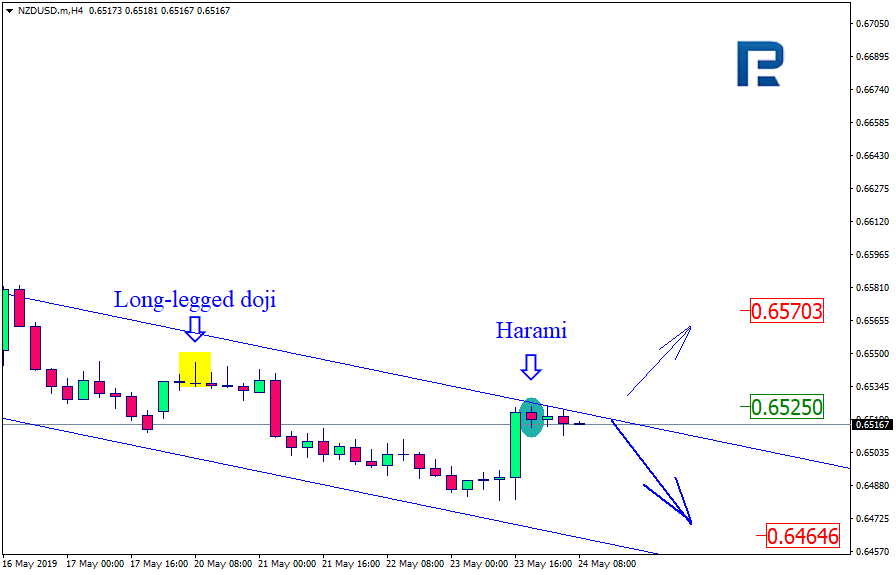
NZD USD, “New Zealand Dollar vs. US Dollar”
As we can see at the H4 chart of NZD USD, the price is still falling and forming Engulfing, Shooting Star, and Long-Legged Doji reversal patterns during pullbacks. After another significant decline, the pair was stopped by the support level. Later, the instrument is expected to form another correction towards 0.7200 before starting a new descending movement.
RoboForex Analytical Department