Monthly technical analysis and forecast for July 2025
In our monthly technical analysis, we examine key chart patterns and levels for the EURUSD, USDJPY, GBPUSD, AUDUSD, USDCAD pairs, gold (XAUUSD), and Brent crude oil to forecast potential developments for July 2025.
Major technical levels to watch in July 2025
- EURUSD: Support 1.1575 – 1.1160. Resistance 1.1777 – 1.2115
- USDJPY: Support 143.40 – 127.30. Resistance 147.50 – 151.00
- GBPUSD: Support 1.3570 – 1.3100. Resistance 1.3770 – 1.4000
- AUDUSD: Support 0.6370 – 0.6000. Resistance 0.6450 – 0.6977
- USDCAD: Support 1.3500 – 1.3250. Resistance 1.3750 – 1.4020
- Gold (XAUUSD): Support: 3200, 3000. Resistance: 3500, 4000
- Brent: Support: 65, 62, 60. Resistance: 77, 82, 93
EURUSD forecast
Support at 1.1100, which the market formed in May, now exerts key pressure on the US dollar. The geopolitical instability that has constrained the euro-area economy since early 2023 gradually fades, allowing the euro to strengthen while the dollar weakens.
The US Federal Reserve grows increasingly hesitant about further tightening. A lack of clear economic drivers, a widening budget deficit and a rising debt burden undermine the dollar. Against this backdrop inflation risks intensify and commodity and energy prices keep moving upwards.
At the same time the ECB, despite maintaining a moderately hawkish tone, benefits from stabilising economic indicators in Germany and France. Investors start to look for a dollar alternative in euro-denominated assets.
Therefore a bullish mood prevails for EURUSD in July, especially if inflationary pressure in the United States persists and the Fed reacts sluggishly.
EURUSD technical analysis
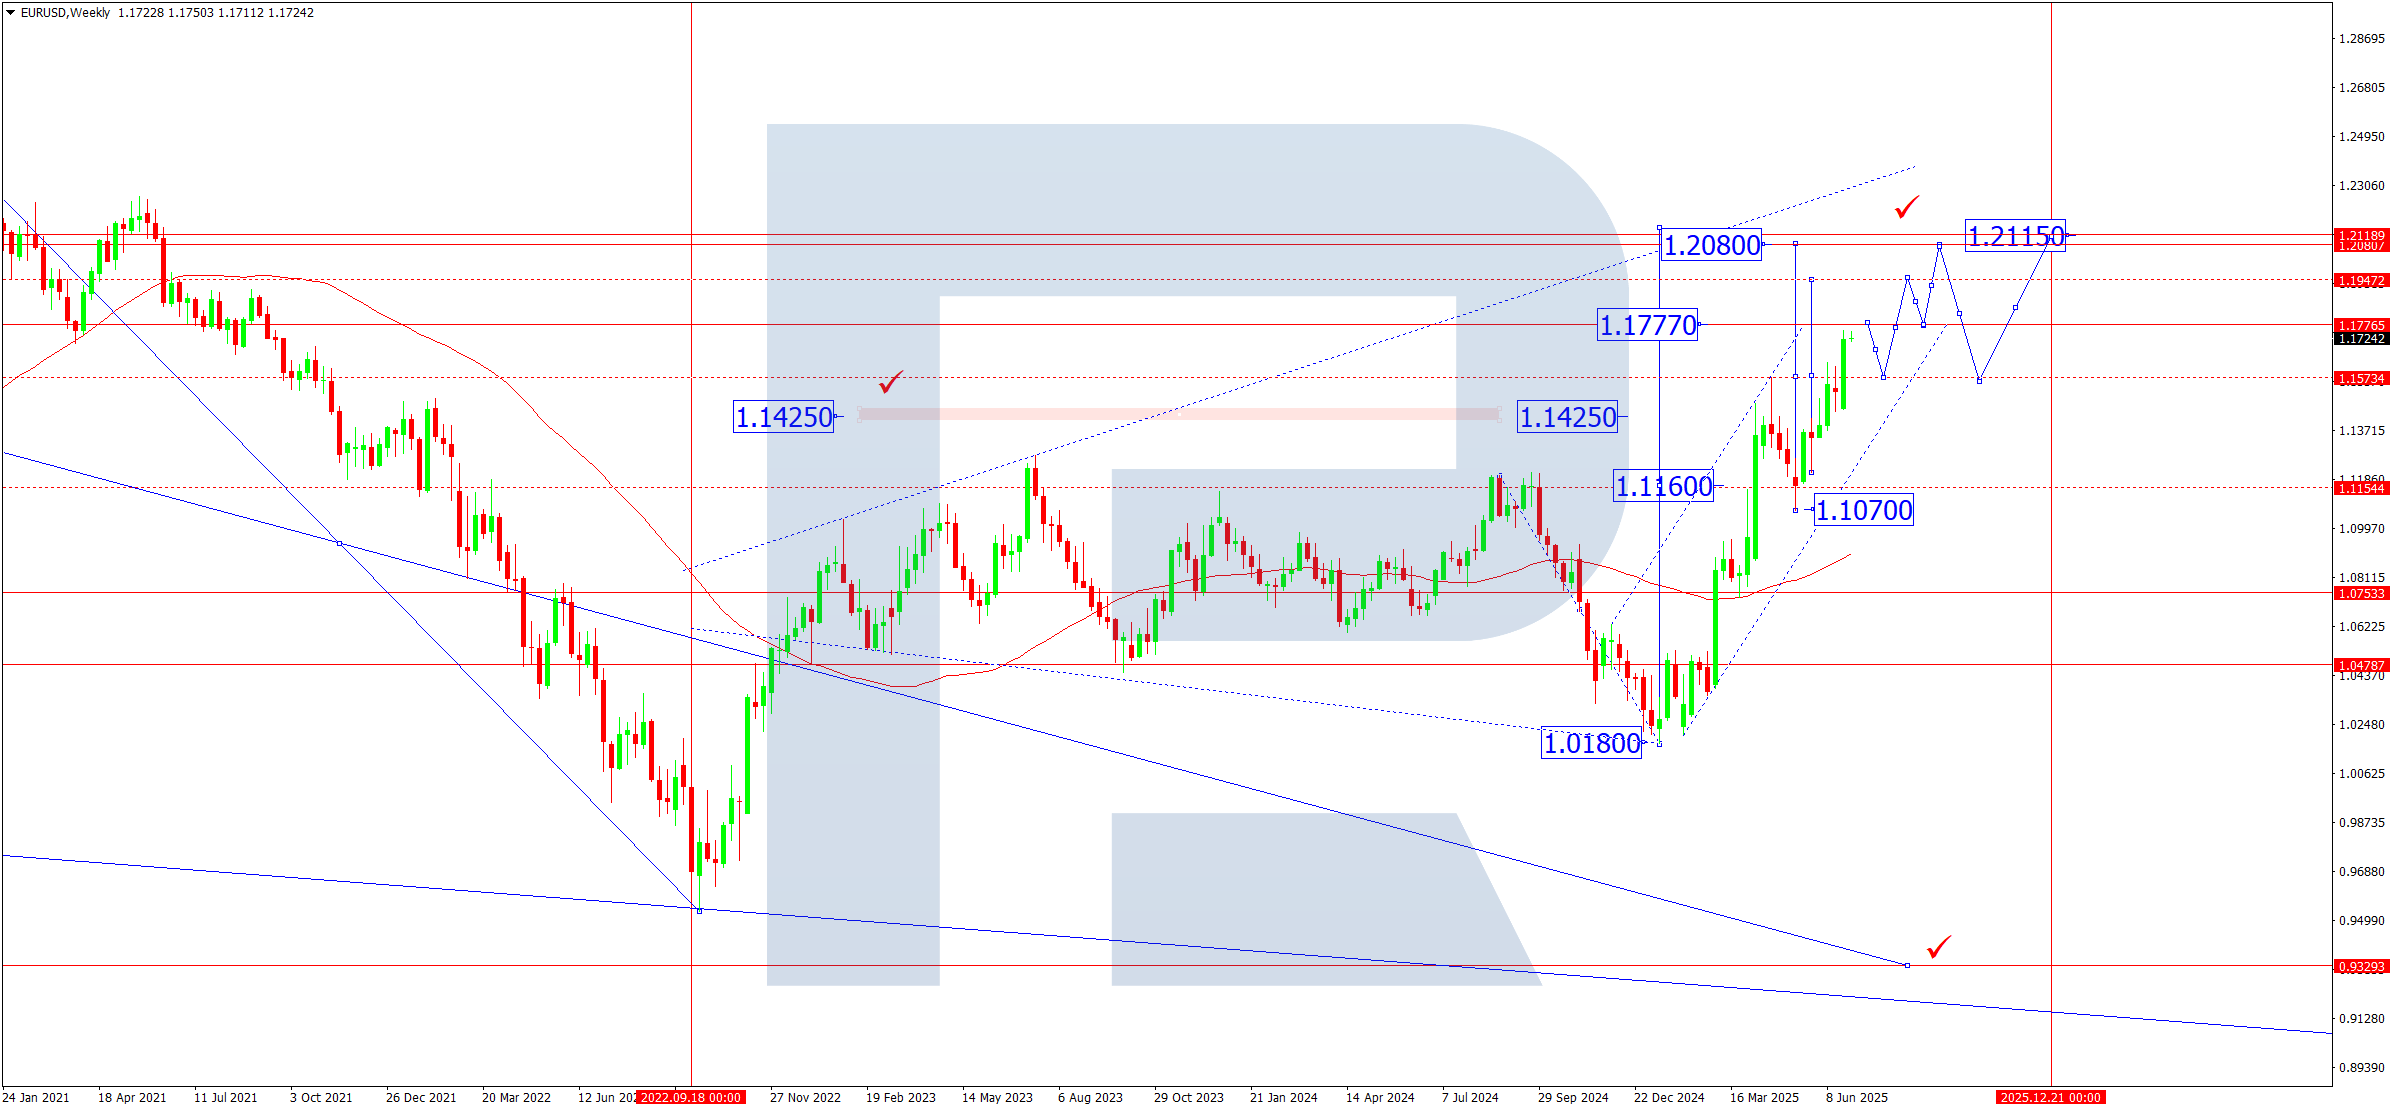
On the weekly chart EURUSD keeps a steady upwards move that began in January 2025. A close above the key 1.1160 level cleared the way for a medium-term target equal to the width of the previous consolidation range. The current structure forms a bullish channel with an upper target near 1.2115 – the May 2021 high.
The chart shows a clear 1.1575-1.1777 consolidation band inside which the pair undertakes a local correction. The 1.1160 Pivot Point represents the long-term balance between supply and demand.
The rising SMA50 confirms the dominance of the up-trend.
ing uptrend.
EURUSD forecast scenarios for July 2025
Bullish scenario: A confident break and close above 1.1777 will confirm trend continuation. Target levels lie at 1.2000, followed by a possible pull-back to 1.1575 and a renewed rise towards 1.2115.
Bearish scenario: A breach of 1.1575 with a close below 1.1500 will signal the start of a deeper correction. In that case the nearest objective sits at 1.1160.
USDJPY forecast
Since January 2025 USDJPY has traded under pressure – the market corrects from the multi-year peak around 159.00, signalling the end of the previous growth phase. The upward impulse has clearly run out, especially against weak US macro data.
The June labour-market report disappointed: employment grew by only 0.5 % versus the expected 3.5 %, a figure within statistical error. The US administration’s tough tariff policy, especially in trade with Asia, also pressures the economy, reducing demand for the dollar as a haven against the yen.
Expectations of further correction therefore intensify. Meanwhile the Japanese authorities have repeatedly stated their readiness to intervene if the yen stays above 145.00, which keeps speculative demand in check.
Combined geopolitical risks, weak data and the Fed’s cautious stance support a scenario of further USDJPY decline in the medium term.
USDJPY technical analysis
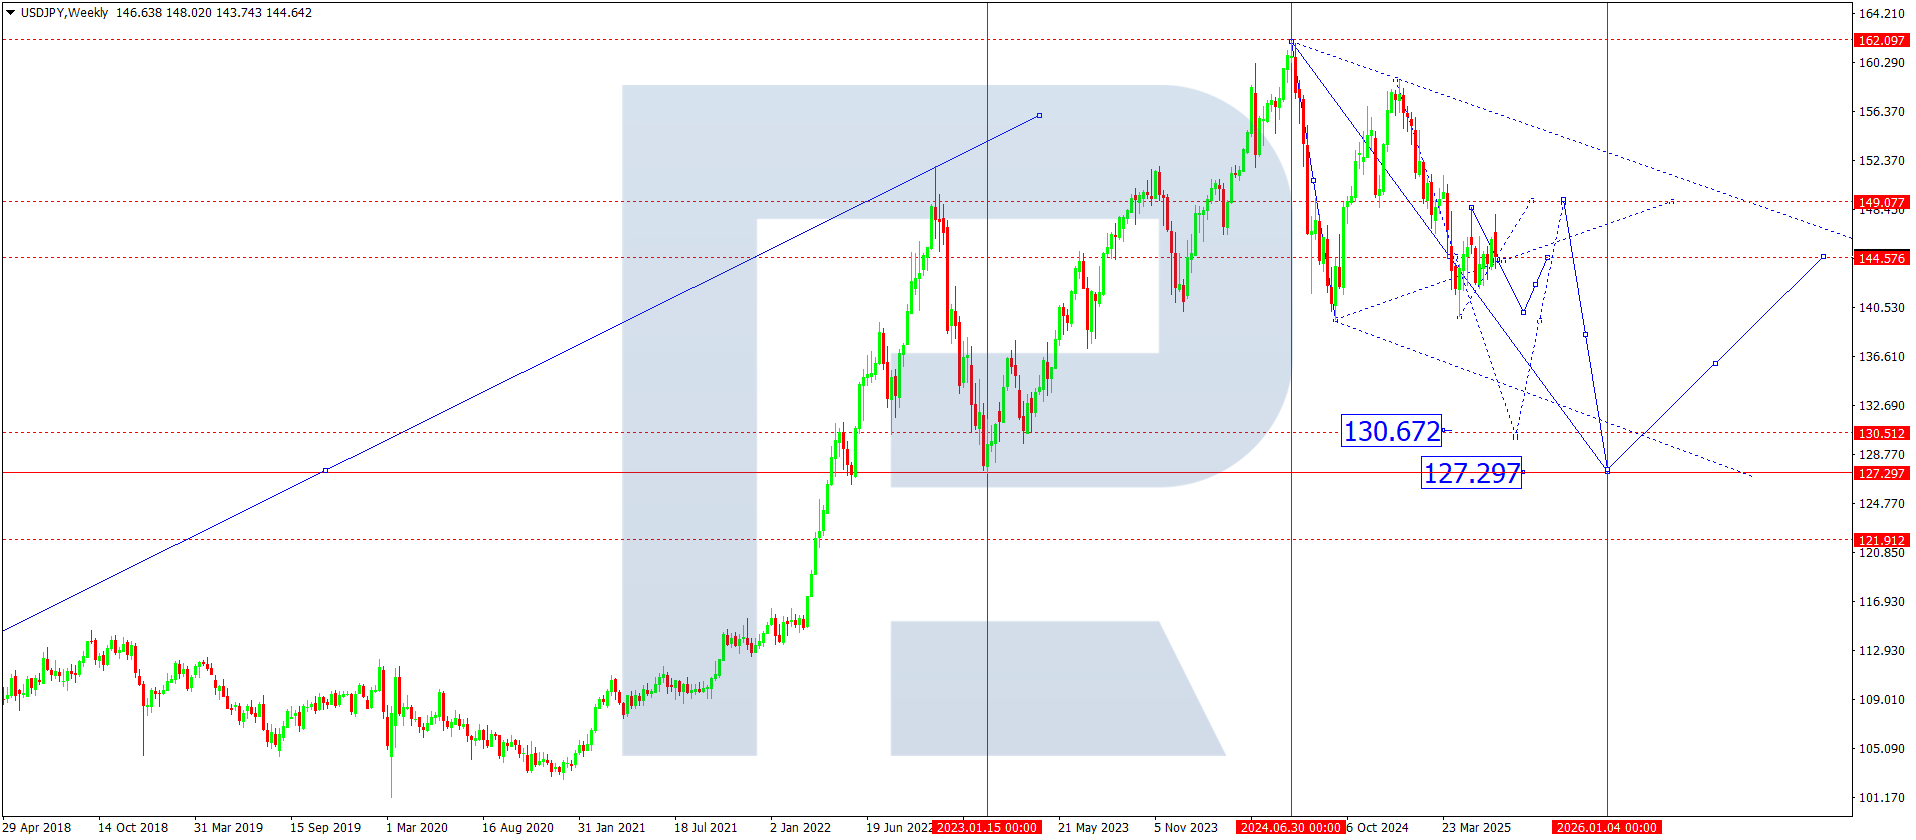
On the weekly chart USDJPY trades inside a broadening corrective triangle that began to form after the all-time high at 161.90. Since January 2025 the market has drawn out a downward structure whose local goal is 130.70, the nearest level of seller interest.
The present consolidation around 145.00 forms an equilibrium zone – the Pivot Point – that guides the third downward wave.
After the price reaches 130.70 a short-term rebound towards 145.00 may develop, followed by renewed decline towards 127.30, a strong support area.
The SMA50 sits above the current price and presses from above, confirming the medium-term bearish trend.
USDJPY forecast scenarios for July 2025
Bearish scenario: A break of 143.40 with a close below 143.00 will open the way for a fall to 130.70 and, if downward momentum strengthens, to 127.30.
Bullish scenario: A sustained break and close above 147.50 will signal a return to the bullish channel. The pair can then rise to 151.00 and, under stronger momentum, to 155.00.
GBPUSD forecast
GBPUSD kept moving upwards, refreshed the highs since January 2022 and touched 1.3770. Weaker US dollar dynamics, the Fed’s change of tone and calmer geopolitics drive sterling strength.
Fed Chair Jerome Powell’s comments about various monetary-policy scenarios heightened expectations of imminent US rate cuts. Given soft inflation and employment figures, the market has priced in aggressive easing.
In the United Kingdom officials have also hinted at possible rate reductions. Bank of England Governor Andrew Bailey and Deputy Governor Dave Ramsden suggested looser policy amid slower activity and a cooling labour market. Ramsden separately pointed to the risk of inflation below the 2 % target, strengthening expectations of a dovish stance in the coming months.
Reduced tension between Iran and Israel adds a mildly positive backdrop, lowering safe-haven demand for the dollar.
GBPUSD technical analysis
On the weekly chart GBPUSD maintains a resilient up-trend that began in January 2025. A decisive break above the long-term consolidation upper boundary opened the way for a fifth upwards wave targeting 1.4000 – a meaningful resistance and psychological mark.
At present the pair consolidates near 1.3570; a break of 1.3770 will aim at the main objective. In the short term a correction that retests 1.3570 from above may appear.
After the pair meets 1.4000 a reversal towards 1.2100 may become technically justified, especially if the dollar regains strength.
USDJPY forecast scenarios for July 2025
Bearish scenario: A break of 1.3570 with a close below may activate sellers, paving the way for a decline to 1.3100, particularly if US Treasury yields rise and the dollar strengthens.
Bullish scenario: Holding the price above 1.3570 and then breaking 1.3770 will allow the up-trend to continue, aiming at 1.4000.
AUDUSD forecast
AUDUSD completed a downward wave in April 2025 and has shown firm recovery since. The Reserve Bank of Australia’s expected policy easing provides the main growth impulse.
By late June markets assign a 90 % probability to a 25-basis-point RBA rate cut in July, which spurs short-term demand for risk assets such as the Australian dollar.
A slight improvement in global sentiment and lower trade risk also support AUD. Investors focus on upcoming US PCE inflation data and Australian retail sales – releases that may set AUDUSD direction in July.
AUDUSD technical analysis
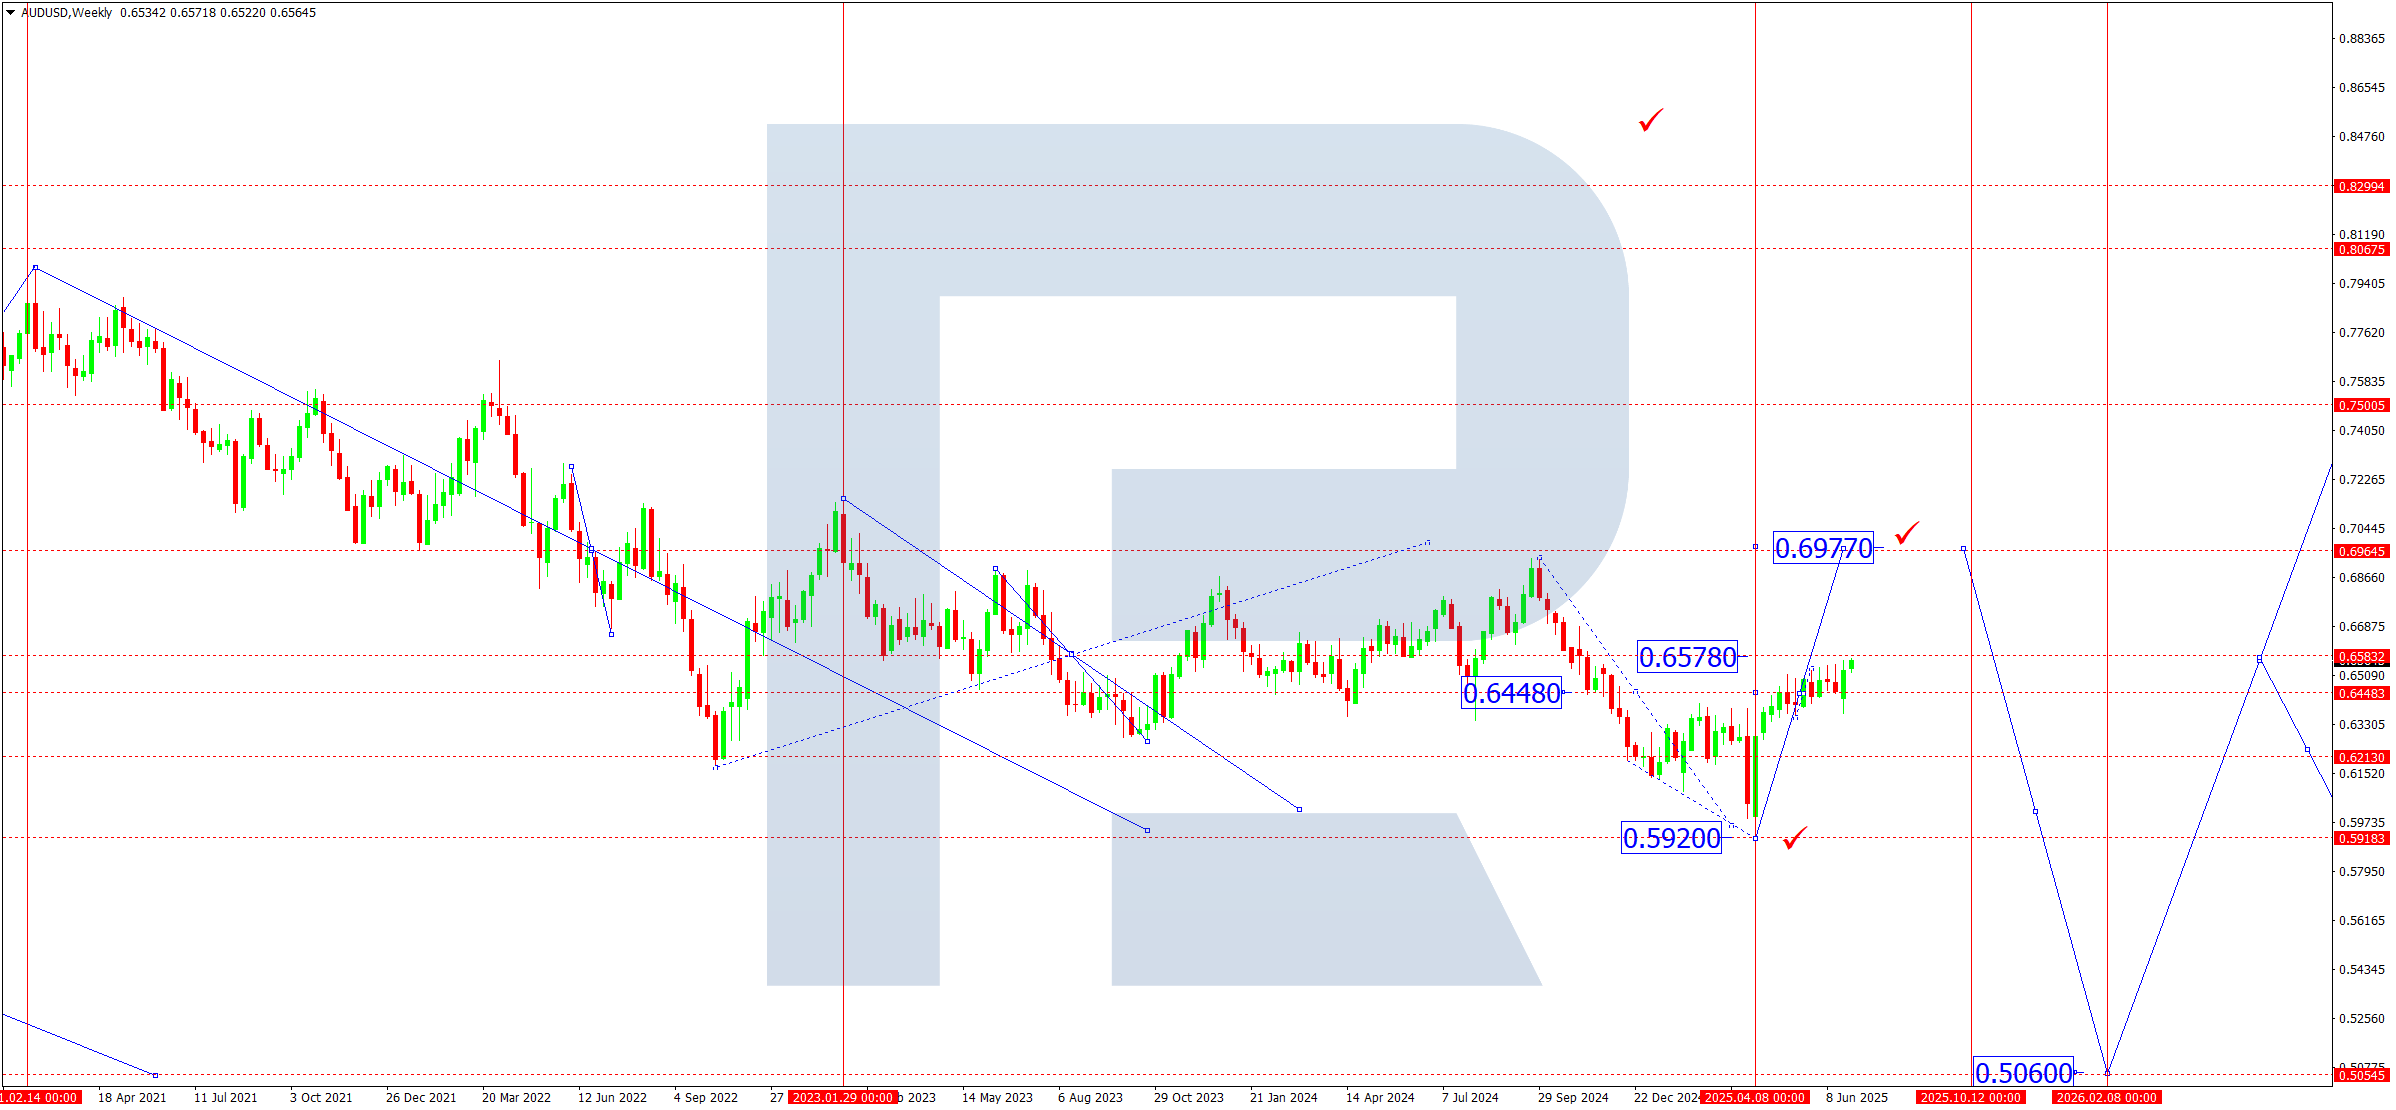
On the weekly chart AUDUSD finished its decline at 0.5920 before entering a growth phase. The first impulse stalled at 0.6450, and the price now forms a 0.6370-0.6450 consolidation range.
A decisive break above the SMA50 strengthened the bullish mood. Support around 0.6370 acts as a local Pivot Point, and the pair’s further path depends on whether the market protects this level.
A topside exit opens potential for a rise to 0.6720, possibly extending to 0.6977 – the long-term structure’s upper boundary.
If the price breaks 0.6370 downwards a pull-back to 0.6200 may unfold; stronger selling pressure could drive it to 0.6000.
AUDUSD forecast scenarios for July 2025
Bearish scenario: A break of 0.6370 with a close below will open the road to 0.6200 and then 0.6000. Higher volatility in commodity markets could accelerate the move.
Bullish scenario: A break of 0.6450 will trigger growth. The first goal lies at 0.6720; after a brief correction the trend may stretch towards 0.6977.
USDCAD forecast
USDCAD remains under pressure after the upward phase that ended in February 2025, when the rate hit a local peak at 1.4790. Since then the Canadian dollar has strengthened steadily, supported by domestic and external factors.
Normalising trade relations between the United States and Canada provide one key driver of the pair’s fall. Canada cancelled a planned digital tax, a gesture markets welcomed as a sign of dialogue and de-escalation.
The move reduced the likelihood of US counter-tariffs, lifting pressure on Canadian business activity. A moderately weaker US dollar keeps demand firm for CAD.
Market participants now focus on an upcoming speech by FOMC member Raphael Bostic, who may hint at the Fed’s future course. With inflation slowing and labour data soft, traders see a higher chance of a US rate cut before the end of Q3 2025, which weakens the dollar and boosts interest in commodity-linked currencies, including CAD.
Canada, an oil exporter, also enjoys support from stable WTI prices. Although macro surprises remain limited, Canada’s economy shows moderate resilience: the labour market stays stable, inflation declines in line with forecasts and domestic demand remains restrained.
Analysts expect the Bank of Canada to leave its rate unchanged in July but hint at easing later in summer – if the Fed moves first.
USDCAD technical analysis
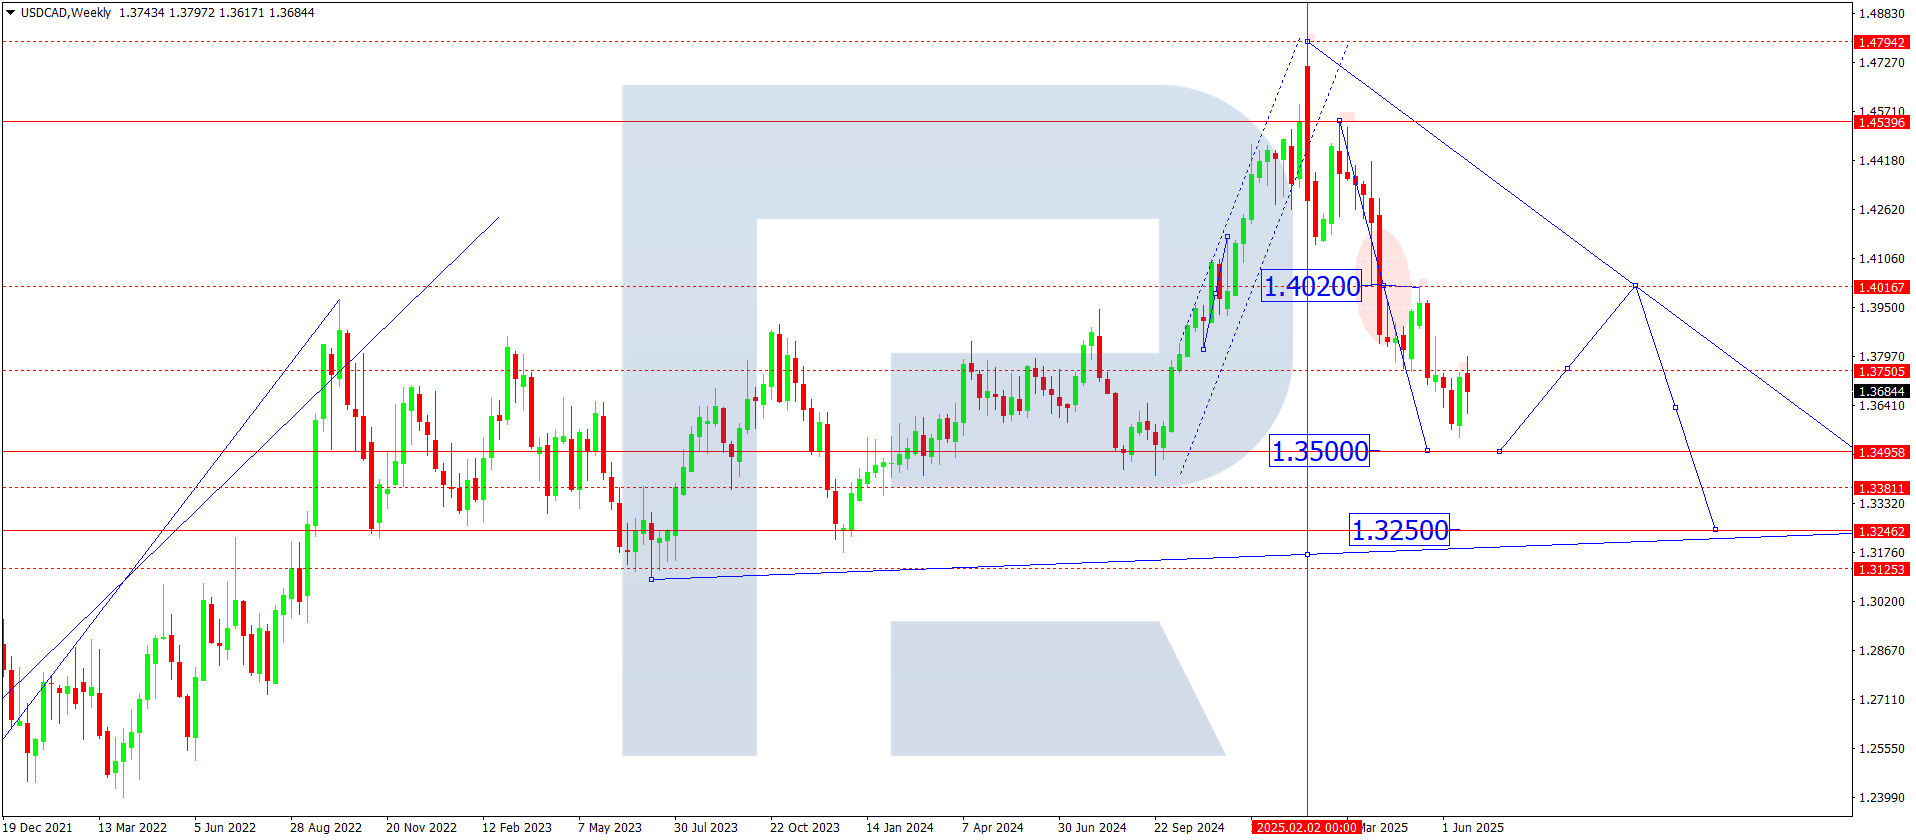
On the weekly chart the pair bounced from the important 1.4020 Pivot Point and builds a clear downward structure characteristic of a third wave. The current impulse targets 1.3500, where a short pause and correction may occur.
After hitting that goal the price could rebound to 1.4020, which may act as resistance. The trend stays pressured because the rate trades below the SMA50. The market will probably treat any approach to that average as a chance to open fresh shorts.
If the pair breaks 1.3500, subsequent targets stand at 1.3250 and 1.3100. Should bearish pressure intensify, USDCAD may even reach the psychologically important 1.3000 level.
USDCAD forecast scenarios for July 2025
Bullish scenario: If USDCAD breaks and closes above 1.4020 – especially with confirmation on the weekly chart and a move above the SMA50 – the short-term trend could reverse, pointing to 1.4200.
Bearish scenario: If 1.4020 holds, the pair will probably keep falling to 1.3250; once that level breaks the decline may extend to 1.3100 and further to 1.3000. The bearish pattern will stand while the price trades below the SMA50.
XAUUSD forecast
Since November 2024 gold has staged a historic rally driven by rising geopolitical risks, damaged logistics and fading trust in reserve currencies. Escalation in the Middle East, including strikes on Iranian territory, sharply boosted demand for safe assets. Investors, governments and central banks shifted into risk-hedging mode.
Central banks accelerated gold purchases: IMF data show that net buying in H1 2025 stands as the largest since 1971. Gold therefore becomes the key reserve asset amid potential currency depreciation.
Expectations of Fed rate cuts, slowing global GDP and volatility in commodity markets channel capital into gold as the only asset offering a “risk-free yield” during turbulence.
Pressure on US equities also works in gold’s favour as an alternative long-term investment.
XAUUSD technical analysis
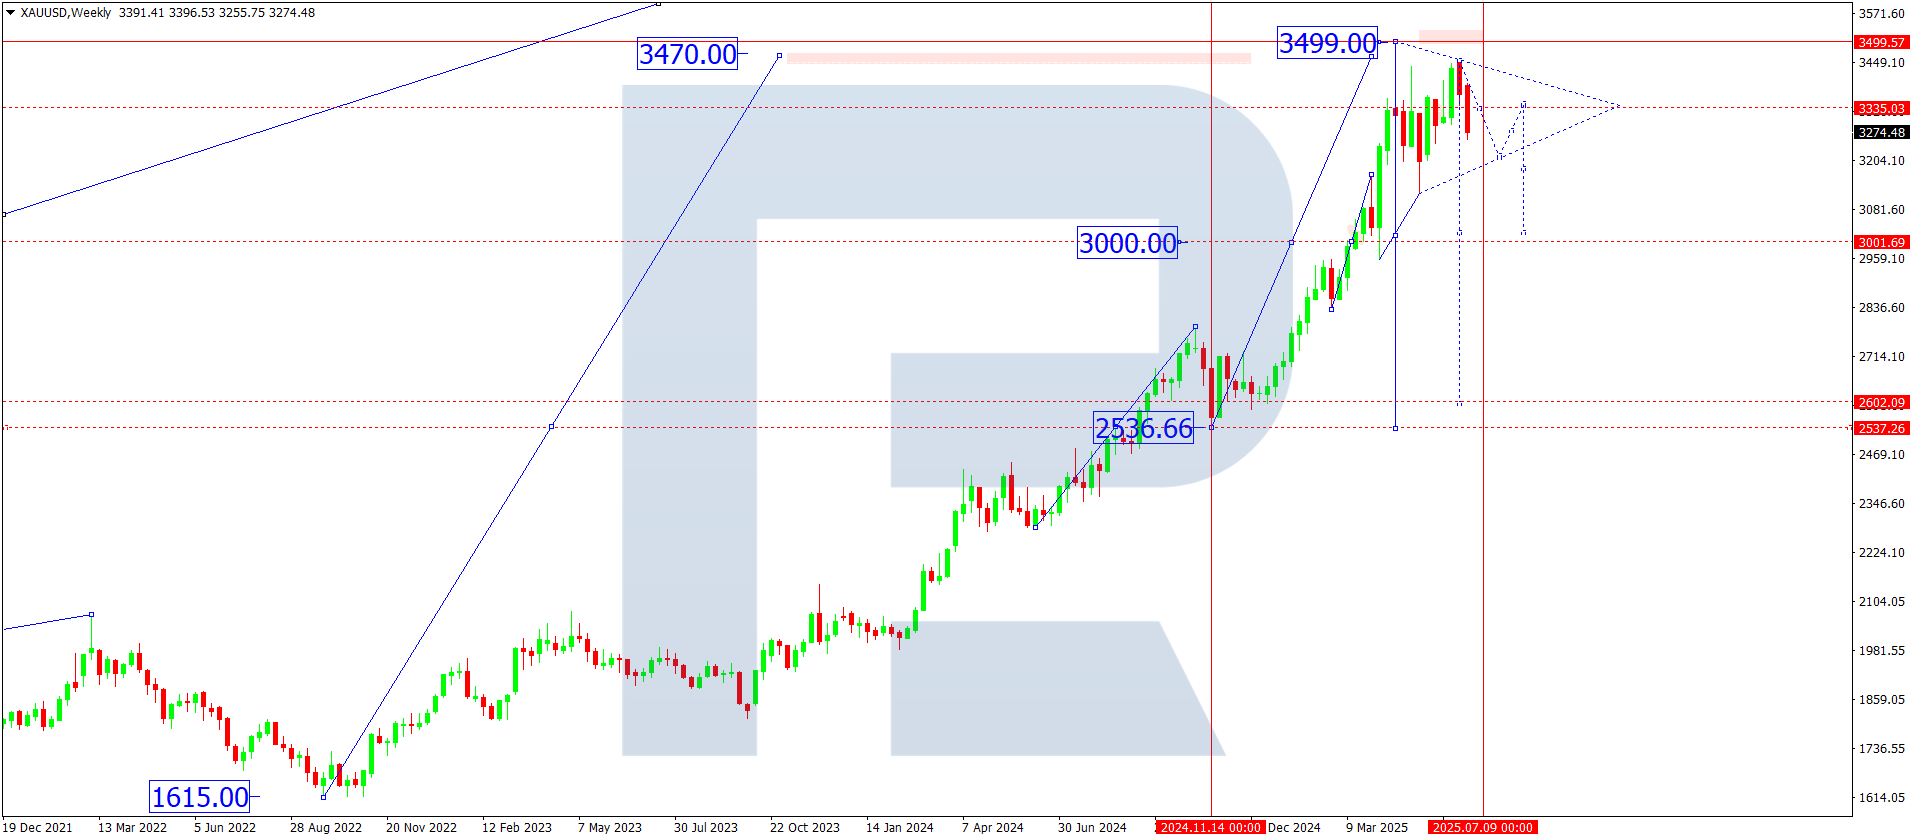
The weekly chart shows that the record high came in April 2025 at 3,499, after which the market entered a correction phase.
Support emerged at 3,124 – the 38.2 % Fibonacci retracement of the November 2024 rally.
A broad 3,120-3,450 consolidation range has formed, with 3,200 acting as a key anchor zone.
The 3,000 level is a crucial psychological barrier and the lower boundary of the medium-term balance.
The formation resembles a flag or high-base structure which, in a trending market, often serves as a platform for a new impulse. The SMA50 continues to slope upwards; the price stays above it and the XAUUSD structure remains firmly bullish.
XAUUSD forecast scenarios for July 2025
Bullish scenario: Holding above 3,200 and breaking 3,450 will allow the price to renew the 3,500 high, then rise to 3,750 and later to 4,000. This level stands as the objective of the current medium-term wave and a key psychological marker. A move through 3,500 may accelerate on geopolitical headlines or Fed signals.
Bearish scenario: If the price breaks below 3,200 it may test the 3,000 zone. A breach of that level will confirm a deeper correction. Attention will then shift to 2,800 and 2,500, areas where the market could stabilise before the next upward trend.
Brent forecast
Brent crude continues its recovery that began in April 2025, supported by OPEC+ verbal and potential interventions and heightened instability in the Middle East. Production-cut discussions stay on the agenda – in June alliance representatives declared readiness to limit supply if demand weakens further.
China, a key oil consumer, still lags expectations: economic recovery slows and energy demand remains below pre-pandemic levels. This caps rapid price growth, yet offsetting falls in US and European inventories balance the effect.
Geopolitical risks – including renewed Iran-Israel tension – stay in focus. Any strikes on infrastructure or tighter sanctions could quickly alter supply and demand.
From a technical viewpoint the pressured US dollar improves the appeal of commodities, including oil.
Brent technical analysis
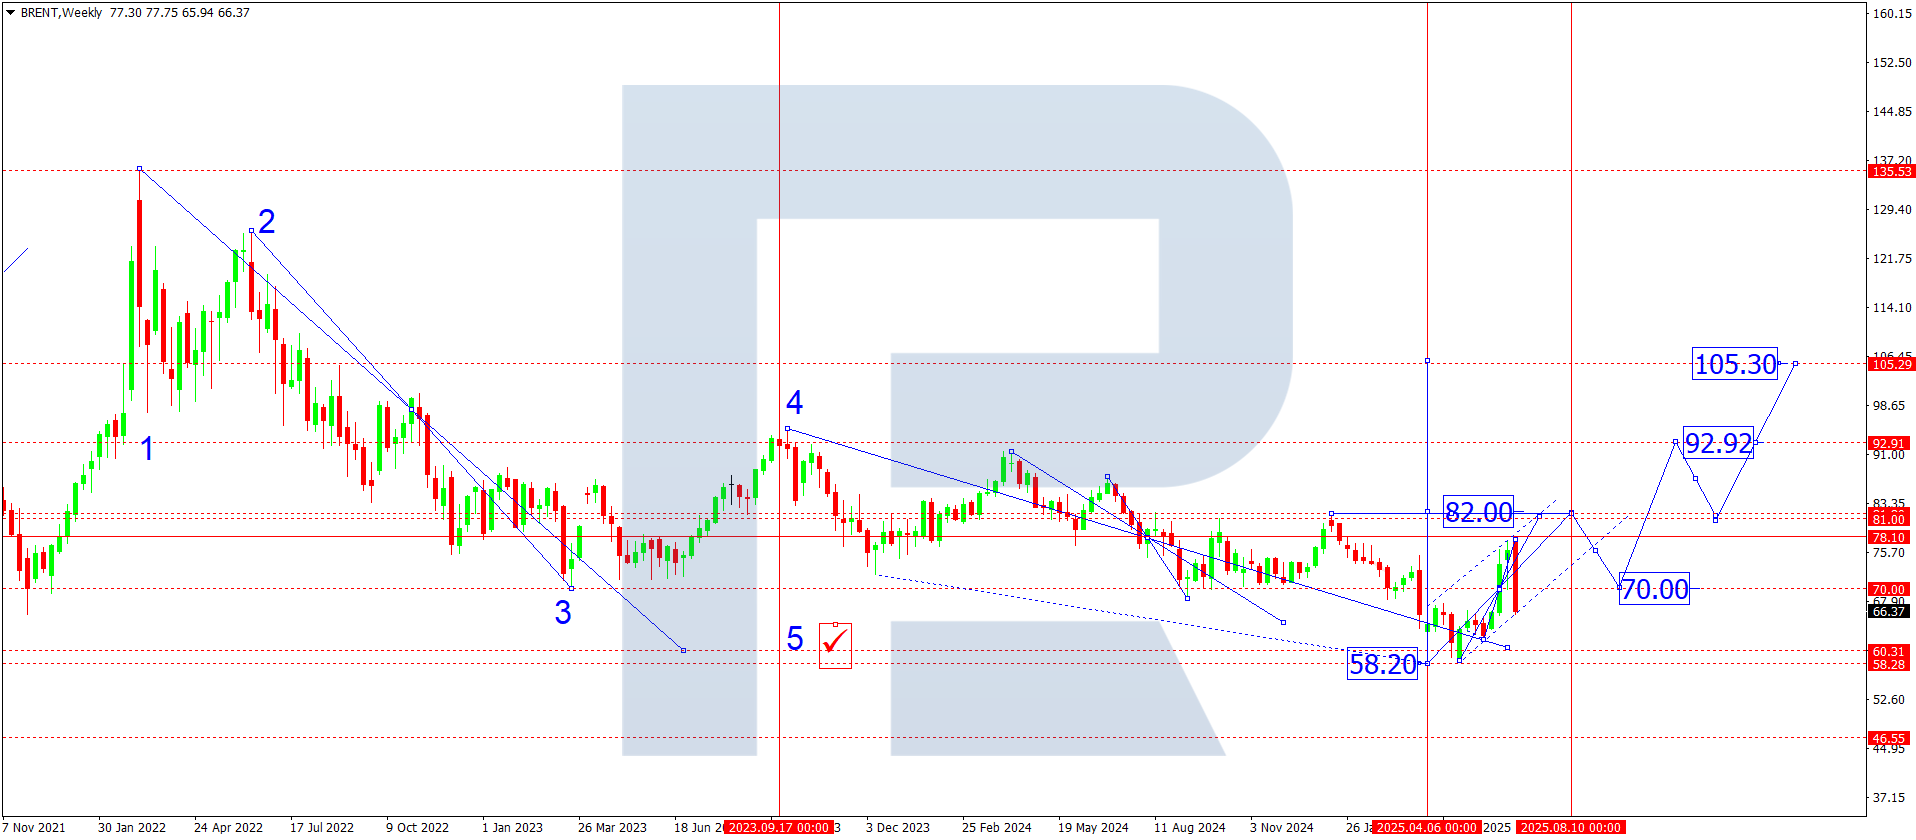
On the weekly chart Brent draws a clear upward wave that began in April at 72. The market broke the important 76-77 consolidation zone, held above the SMA50 and now tests 82, matching the January highs.
The current 77-82 range serves as key resistance. A strong breakthrough would awaken upside potential towards 93 – the autumn 2023 high, a zone that has historically reversed Brent.
If the price retreats, support lies near 76 and 72, where the SMA50 also passes. Below sits the important medium-term level at 66.50. A deep fall seems unlikely without an external shock, but if 66 breaks the market can test 60 – a psychological and fundamental floor.
Brent forecast scenarios for July 2025
Bearish scenario: Without fresh OPEC+ news and under weak global data Brent may return to the 66-72 band. A break below 65 will open the path to 60, which marks the fundamental bottom – below the breakeven price for several exporter nations.
Bullish scenario: If the market stays above 77 and breaks out of the 82 consolidation, we can expect acceleration towards 93, with a potential run to 100 if geopolitical risks build. The 100 level remains crucial for OPEC+ and may guide any quota changes.
