USDCHF, “US Dollar vs Swiss Franc”
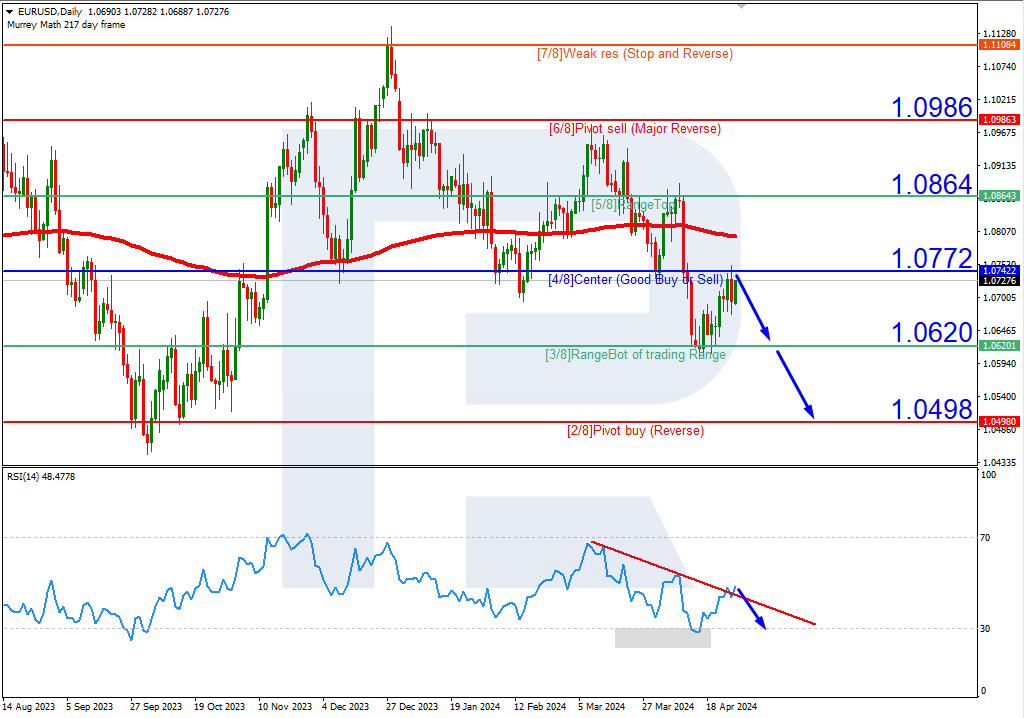
As we can see in the H4 chart, USDCHF is out of the “overbought area”. In this case, the price is expected to break 7/8 and then continue falling towards the support at 6/8. However, this scenario may no longer be valid if the price breaks 8/8 to the upside. After that, the instrument may continue growing to reach +1/8.

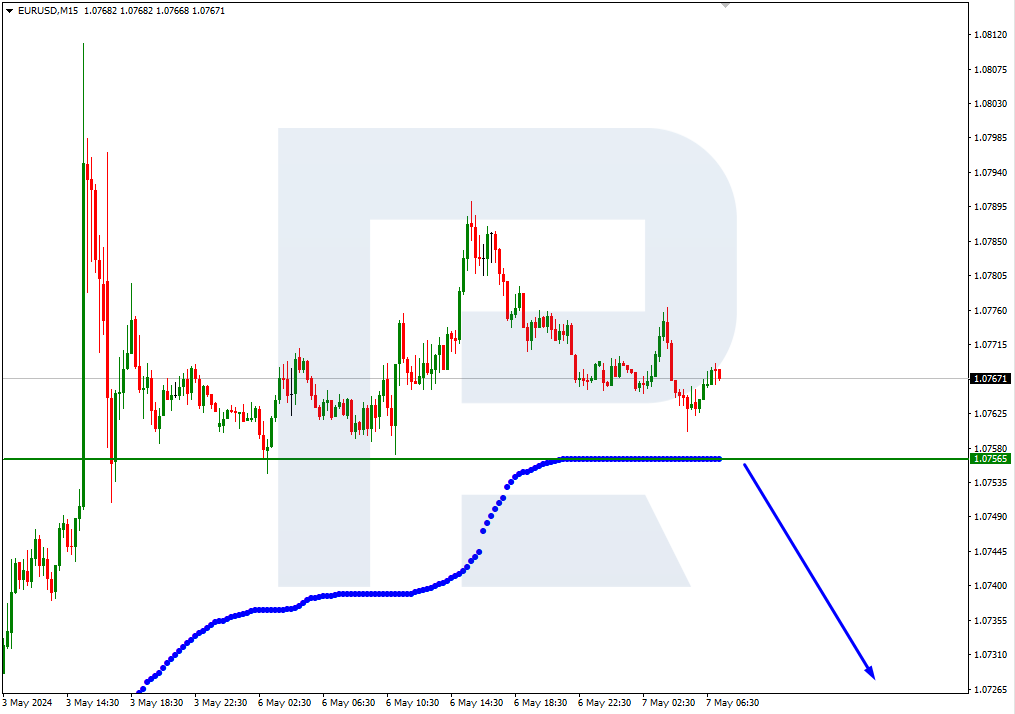
In the M15 chart, the pair may break the downside line of the VoltyChannel indicator and, as a result, continue the descending tendency towards 6/8 from the H4 chart.
XAUUSD, “Gold vs US Dollar”
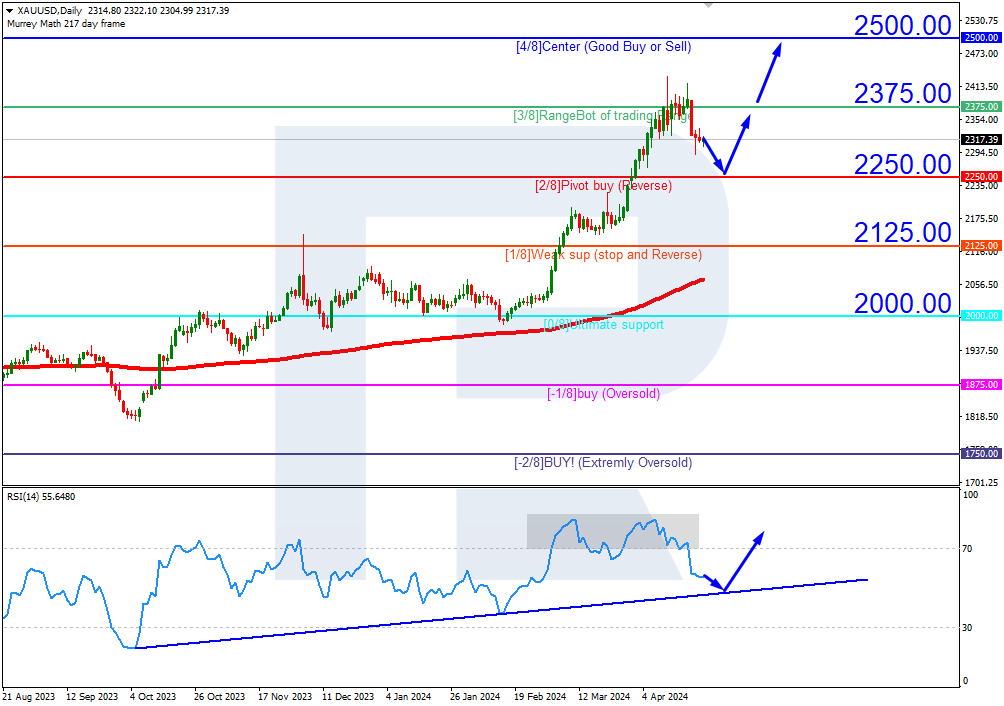
As we can see in the H4 chart, there has been a false breakout of 5/8. In this case, the price is expected to continue falling to reach 3/8. However, this scenario may no longer be valid if the price breaks the resistance at 5/8 to the upside. After that, the instrument may continue growing towards 6/8.
In the M15 chart, the pair may break the downside line of the VoltyChannel indicator and, as a result, continue trading downwards.
