EURUSD, “Euro vs. US Dollar”
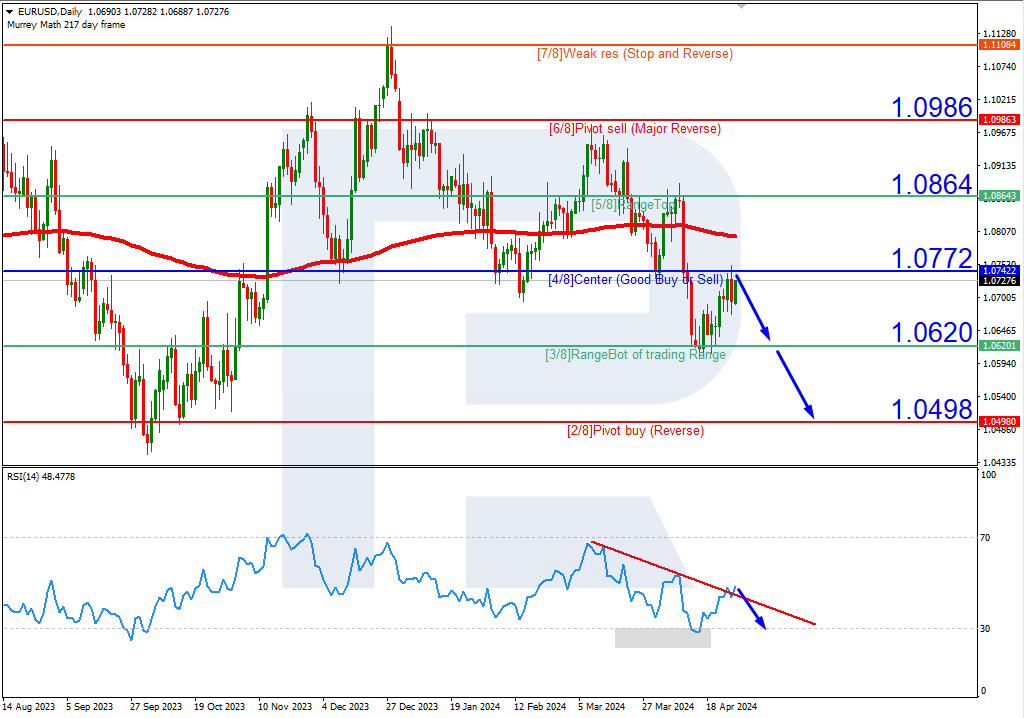
In the H4 chart, EURUSD is consolidating; right now, it is breaking 4/8. In this case, the price is expected to continue falling towards the downside border of the range at 3/8. However, this scenario may no longer be valid if the price breaks 4/8 to the upside. After that, the instrument may continue trading upwards to reach the resistance at 5/8.

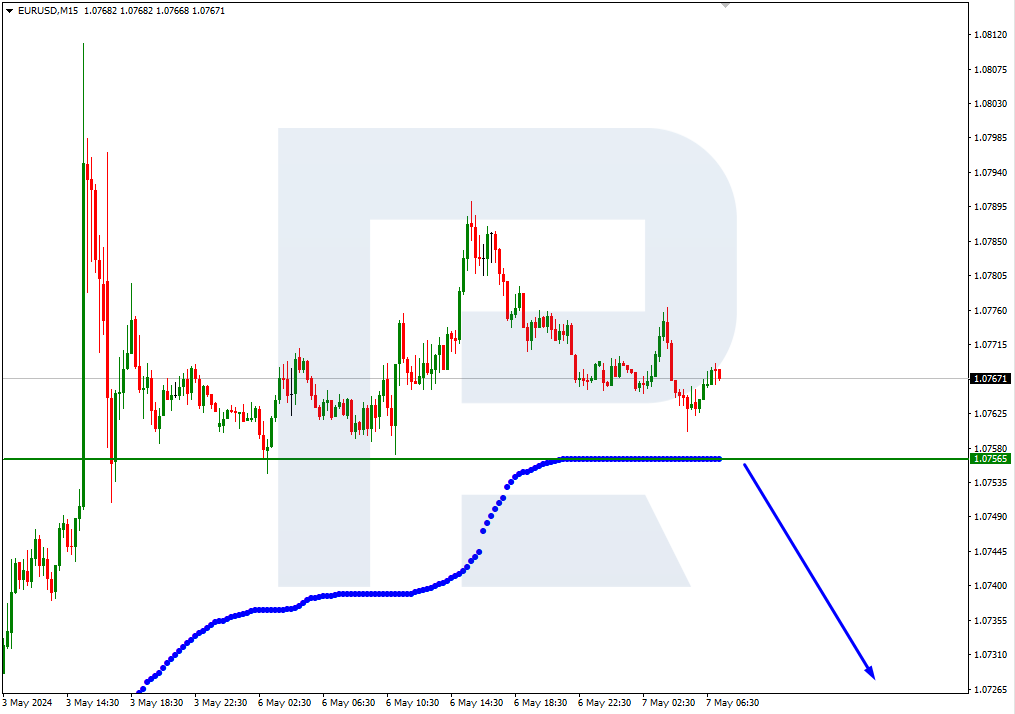
As we can see in the M15 chart, the pair has broken the downside line of the VoltyChannel indicator and, as a result, may continue its decline towards 3/8 from the H4 chart.
GBPUSD, “Great Britain Pound vs US Dollar”
As we can see in the H4 chart, GBPUSD is moving above the 200-day Moving Average, thus confirming an ascending tendency. At the moment, the asset is forming a correction, which is expected to be over at 5/8. In this case, the price may test this level, rebound from it, and then resume moving upwards to reach the resistance at 7/8. However, this scenario may no longer be valid if the price breaks the support at 5/8 to the downside. After that, the instrument may fall to reach 4/8.
In the M15 chart, the price is quite far away from the upside line of the VoltyChannel indicator, that’s why it may resume growing only after rebounding from the 5/8 from the H4 chart.
