EUR USD, “Euro vs US Dollar”
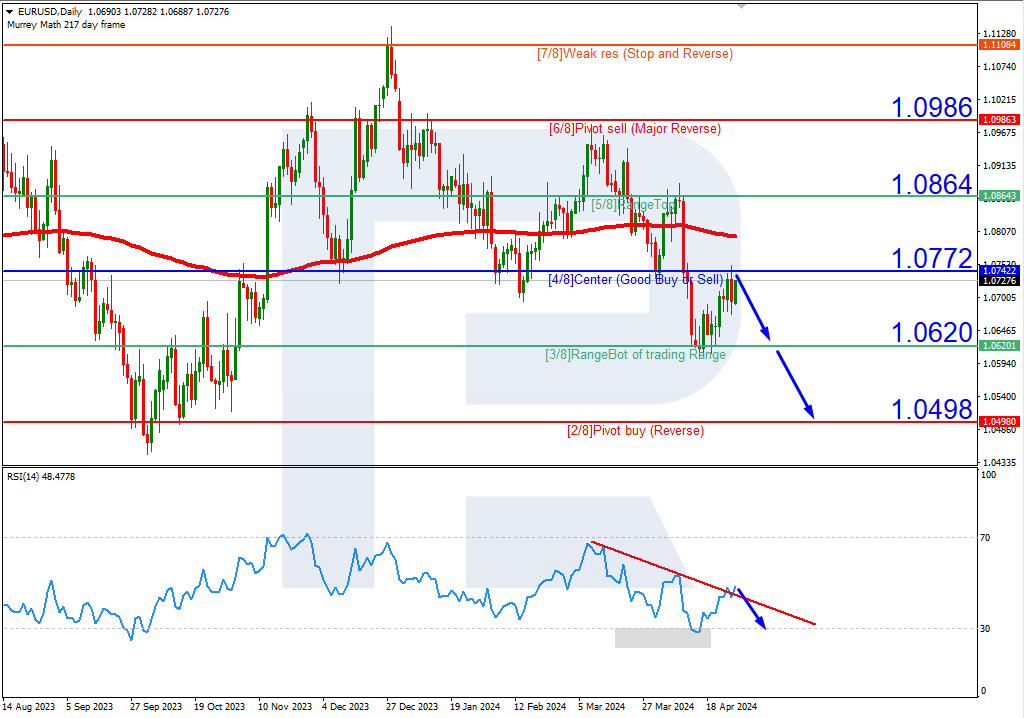
As we can see at the H4 chart, the EUR/USD pair is trading at the resistance at the 4/8 level. Later, the price may rebound from this level and fall towards the 3/8 one at 1.1413 and even break it.
At the H1 chart, the price is trading close to the strong resistance at the 8/8 level, which also indicates that the pair may reverse and continue moving downwards.
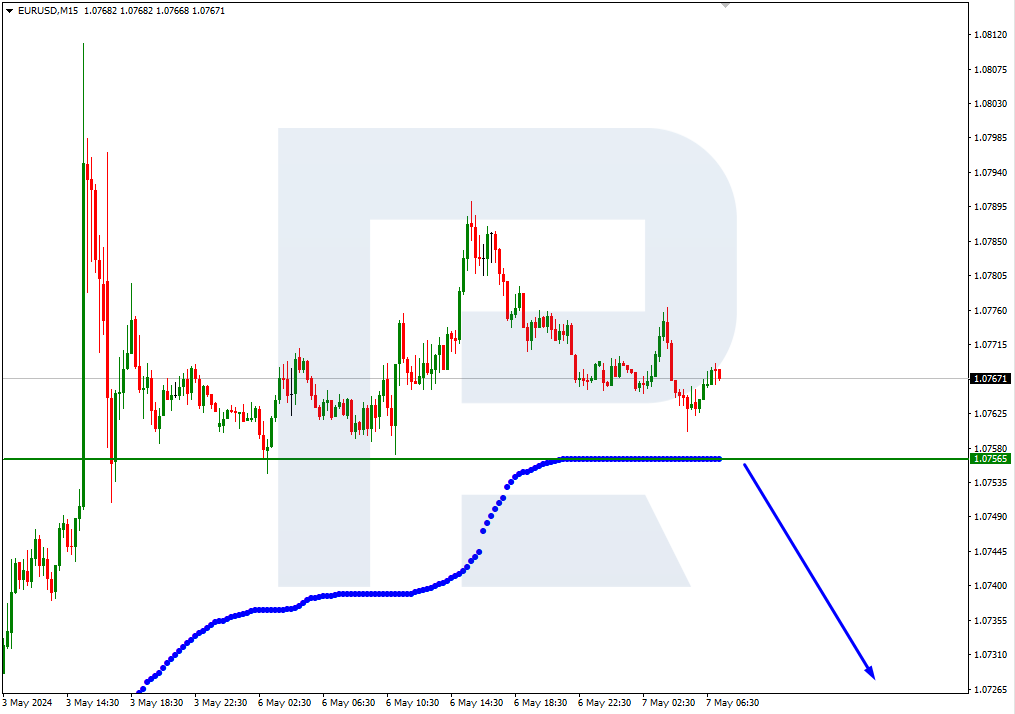
At the M15 chart, the pair broke the downside line of the VoltyChannel indicator. As a result, the price may fall to reach 1.1413.
USD CAD, “US Dollar vs Canadian Dollar”
At the H4 chart, the USD/CAD pair is trading inside the “oversold zone” under the support at the 0/8 level. The price is expected to break this level and then continue moving upwards to reach the 3/8 one at 1.3244.

As we can see at the H1 chart, the pair is expected to break the 3/8 level at 1.2908 and, as a result, may continue growing towards the 8/8 one at 1.3183 and even break it to reach 1.3244.

At the M15 chart, the pair may break the upside line of the VoltyChannel indicator and, as a result, continue moving upwards to reach and break 1.2935.

RoboForex Analytical Department