EURUSD, “Euro vs. US Dollar”
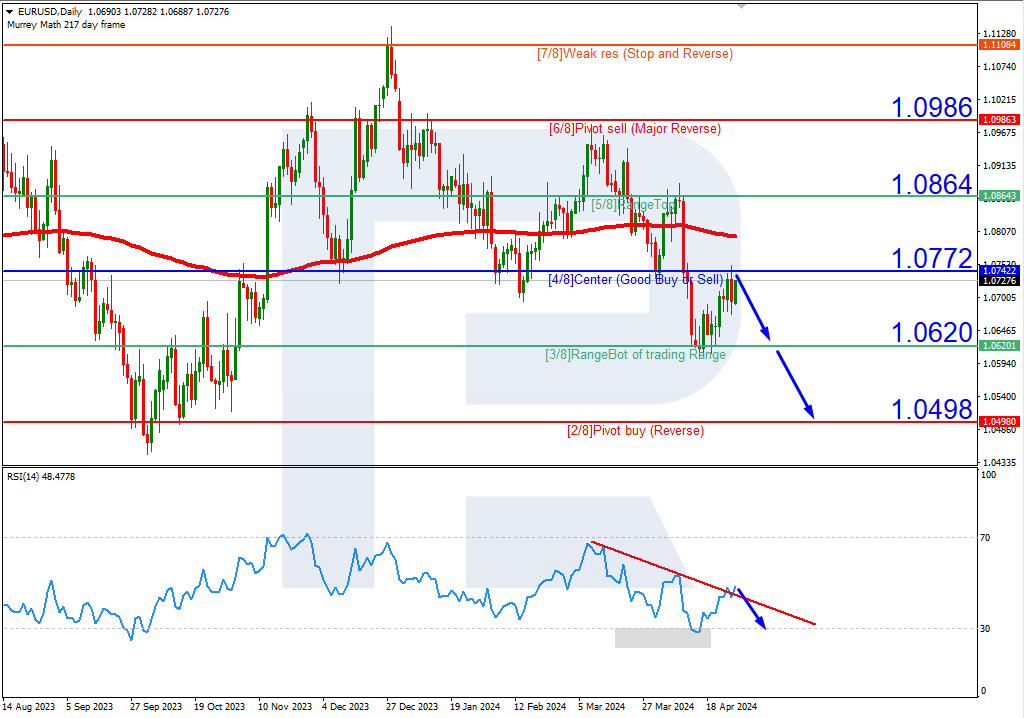
As we can see in the H4 chart, EURUSD is still trading within the “overbought area”. In this case, the price is expected to test +2/8, rebound from it, and then resume falling towards the support at +1/8. However, this scenario may no longer be valid if the price breaks +2/8 to the upside. After that, the lines at the chart will be redrawn, thus helping to define new upside targets.

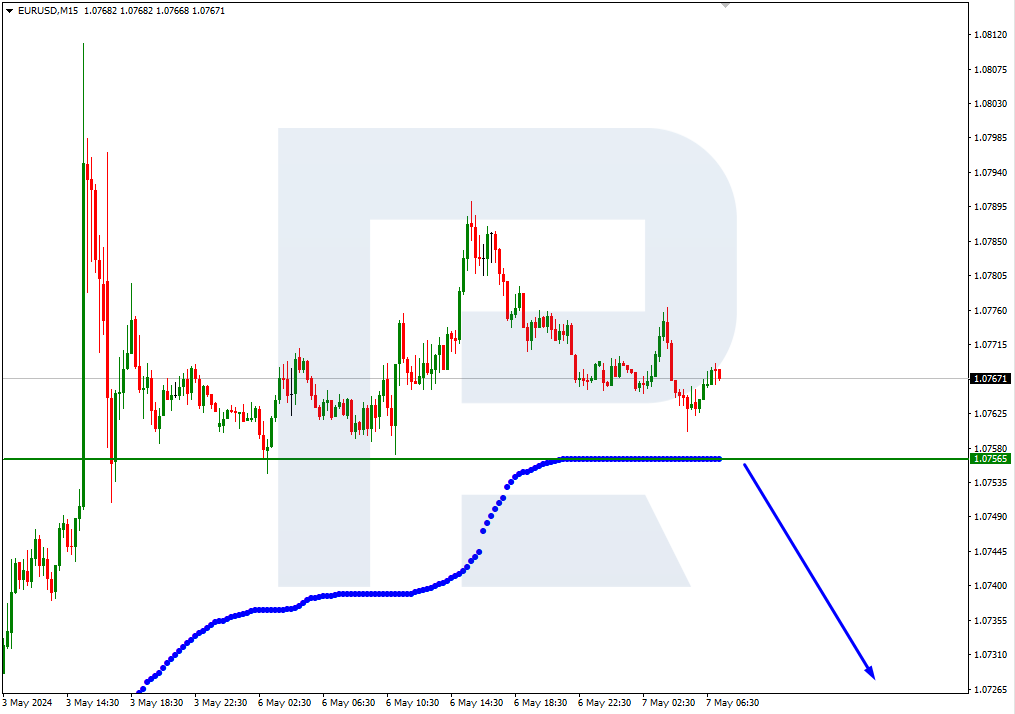
In the M15 chart, the pair may break the downside line of the VoltyChannel indicator and, as a result, may continue its decline towards 8/8 from the H4 chart.
GBPUSD, “Great Britain Pound vs US Dollar”
In the H4 chart, GBPUSD is moving above the 200-day Moving Average, thus confirming an ascending tendency. In this case, the price is expected to rebound from 6/8 and then resume moving upwards to reach the resistance at 8/8. However, this scenario may no longer be valid if the price breaks 6/8 to the downside. After that, the instrument may reverse and fall to reach the closest support at 5/8.
As we can see in the M15 chart, the price has broken the upside line of the VoltyChannel indicator and, as a result, may continue growing.
