USDJPY, “US Dollar vs. Japanese Yen”
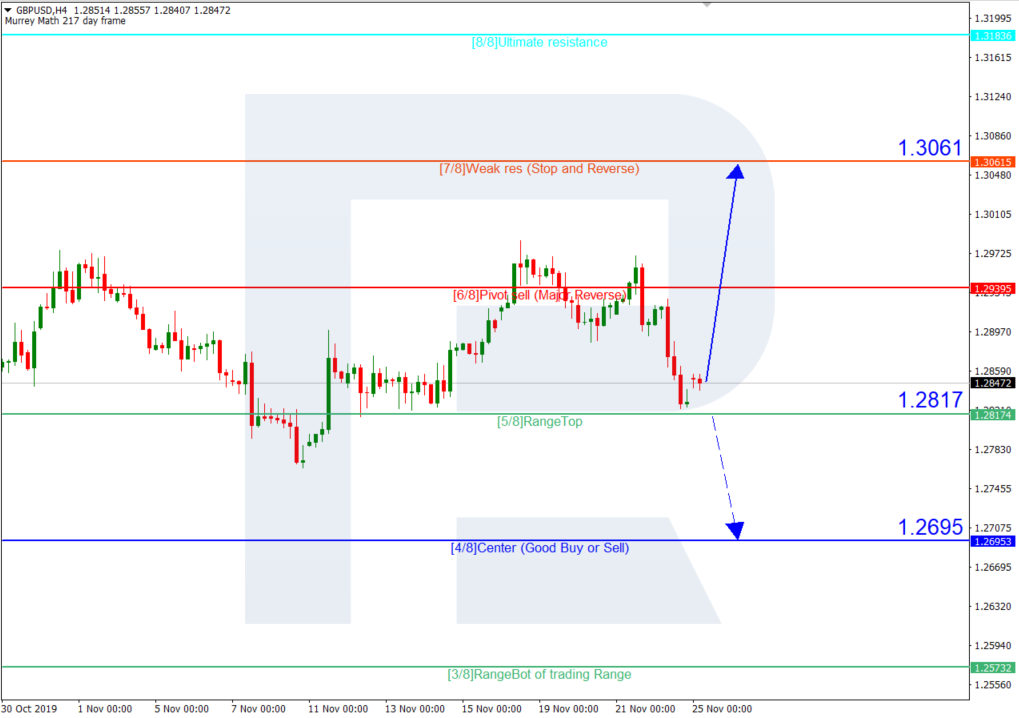
In the H4 chart, USDJPY is still trading below 3/8. In this case, the price is expected to continue falling to reach the support at 0/8. However, this scenario may be no longer valid if the price breaks 3/8. After that, the instrument may resume trading upwards to reach the resistance at 5/8.


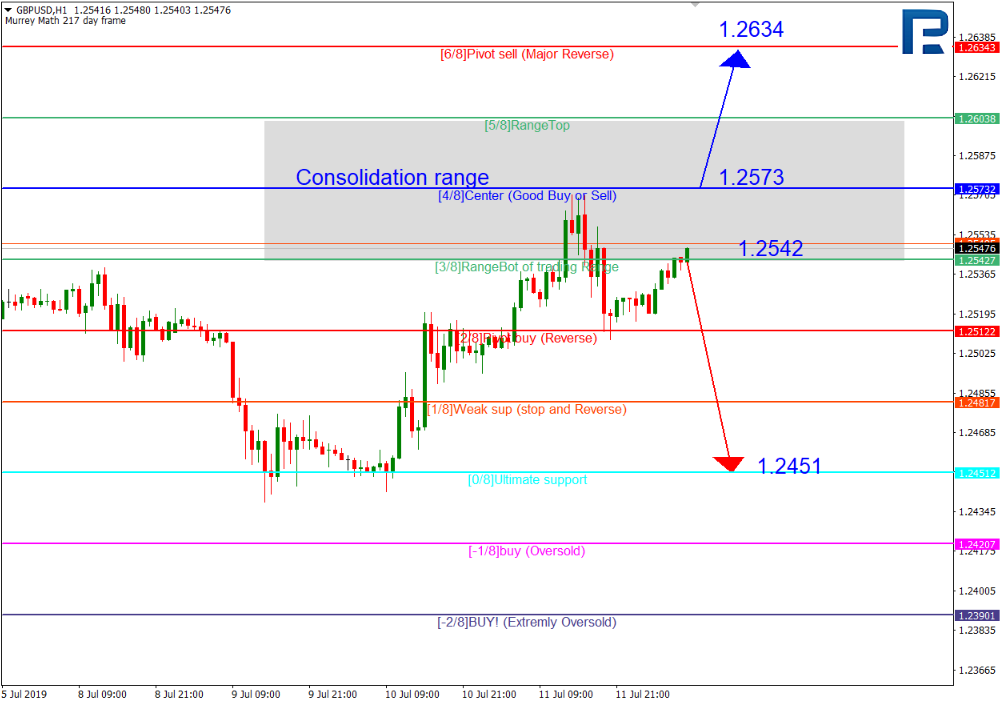
As we can see in the H1 chart, the pair has broken 3/8 and may continue falling.

USDCAD, “US Dollar vs Canadian Dollar”
In the H4 chart, USDCAD is consolidating close to 3/8. If the pair rebound from this level, it may resume growing to reach the resistance at 5/8. However, if the price breaks 3/8, the instrument may continue falling towards 1/8. Right now, both these scenarios are possible, that’s why we should analyze the H1 chart to define the most probable one.
As we can see in the H1 chart, the pair has rebounded from the strong resistance at 8/8. As a result, the price may move downwards to reach the support at 3/8. To confirm this scenario, if the instrument must break 6/8. Hence, the H1 chart analysis is in favor of further decline.