EURUSD, “Euro vs. US Dollar”
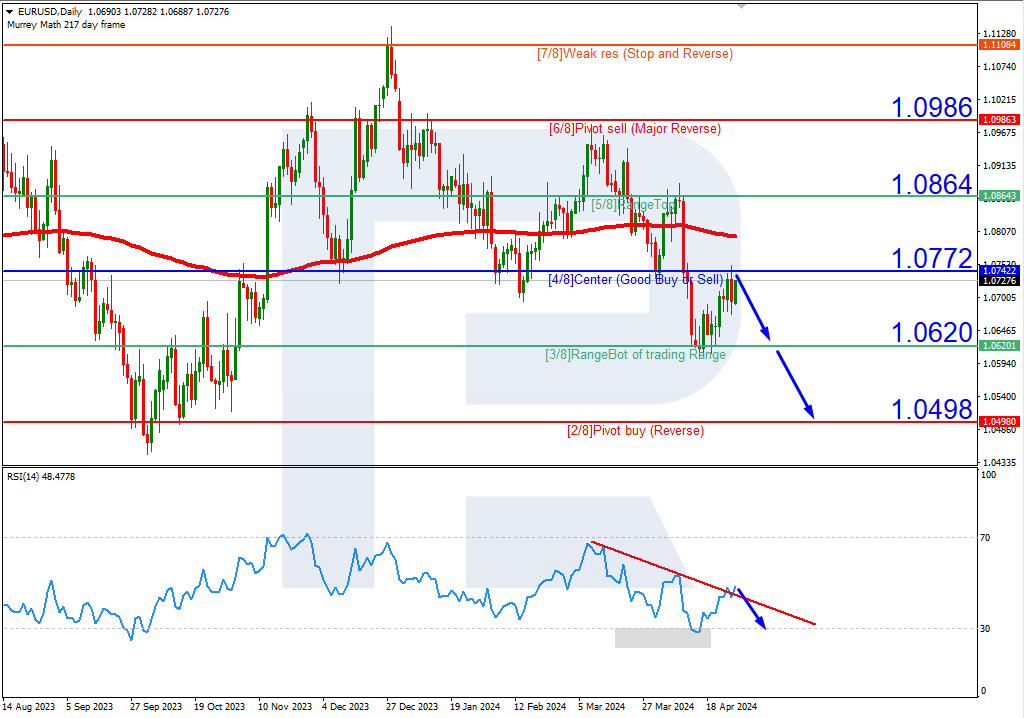
In the H4 chart, EURUSD is moving not far from the “oversold area”. In this case, the pair may test 0/8, rebound from it, and then resume growling towards the resistance at 1/8. However, this scenario may no longer be valid if the price breaks 0/8 to the downside. After that, the instrument may continue falling to reach the support at -1/8.

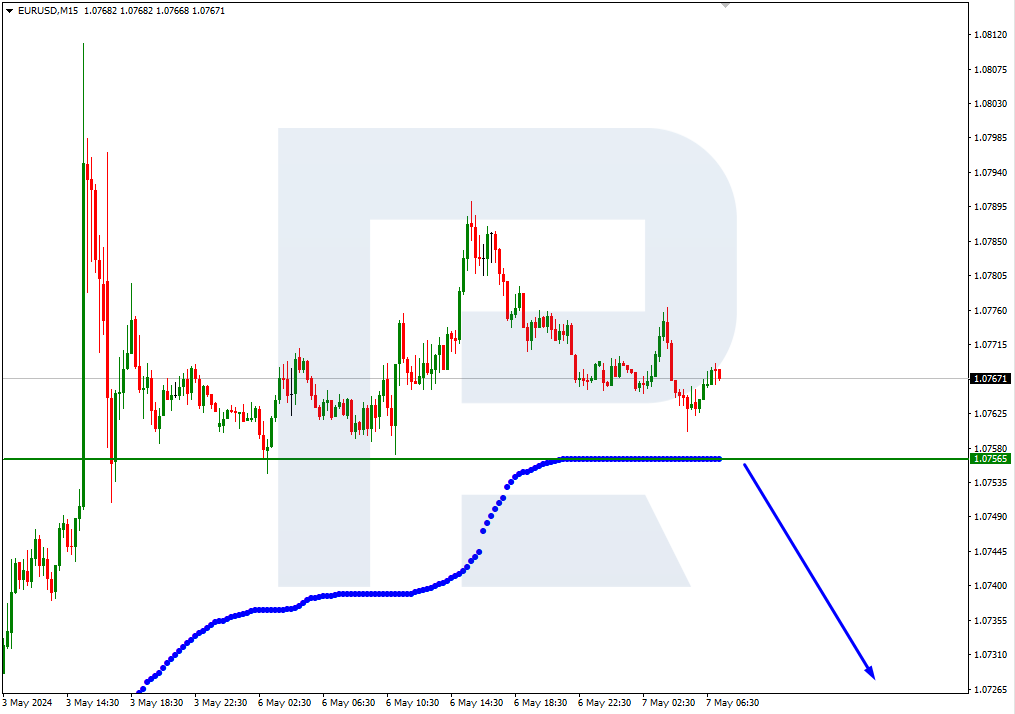
As we can see in the M15 chart, the pair is moving quite far away from the upside line of the VoltyChannel indicator, that’s why only a rebound from 0/8 from the H4 chart may confirm further growth.
GBPUSD, “Great Britain Pound vs US Dollar”
As we can see in the H4 chart, GBPUSD is trading not far from the downside border of the range at 3/8. The main scenario implies that the pair may test this level, rebound from it, and then resume falling towards the support at 2/8. However, this scenario may no longer be valid if the price breaks the resistance at 3/8 to the upside. After that, the instrument may continue growing to reach 4/8.
In the M15 chart, the pair may break the downside line of the VoltyChannel indicator and, as a result, continue trading downwards.
