Technical Analysis & Forecast 25.07.2023
EURUSD, “Euro vs US Dollar”
EURUSD has completed another structure of decline to 1.1059. Today the market is forming a consolidation range above this level. The price is expected to exit downwards and continue this wave to the level of 1.1024. This is a local target. After the price reaches this level, a correction to 1.1125 (a test from below) could develop, followed by a decline to 1.0977.


GBPUSD, “Great Britain Pound vs US Dollar”
GBPUSD has completed a structure of a wave of decline to the 1.2797 level. Today the market is forming a consolidation range above this level. The price is expected to exit downwards and continue the wave to the level of 1.2770. This is a local target. After the price reaches this level, a correction to 1.2860 could start.


USDJPY, “US Dollar vs Japanese Yen”
USDJPY continues developing a correction to the level of 139.80. When the correction is over, another wave of growth to 142.33 could follow.


USDCHF, “US Dollar vs Swiss Franc”
USDCHF continues to form a consolidation range around the 0.8677 level. An exit upwards could open the potential for growth to the 0.8750 level. With an exit downwards, a link of correction to the 0.8625 level is possible, followed by growth to 0.8800.


AUDUSD, “Australian Dollar vs US Dollar”
AUDUSD has completed a structure of a wave of decline to the 0.6714 level. Today a correction to the 0.6766 level has been formed. A wave of decline is expected to develop further to the 0.6688 level. After this level is reached, a correction to 0.6760 could start, followed by a decline to 0.6638.


BRENT
Brent has completed a structure of growth to 82.88. Today a consolidation range is forming above this level. The price is expected to exit upwards and continue to rise to the 83.25 level. After this level is reached, a link of correction to 81.00 (a test from above) is possible, followed by growth to the 84.00 level with the prospect of trend continuation to 85.00. This is a local target.


XAUUSD, “Gold vs US Dollar”
Gold has completed a structure of decline to 1953.20. Today a correction could develop to the 1962.30 level, with the trend continuing to the 1950.40 level. After the price reaches this level, one more link of correction to 1960.30 is possible, followed by a decline to the 1937.15 level. This is the first target.


S&P 500
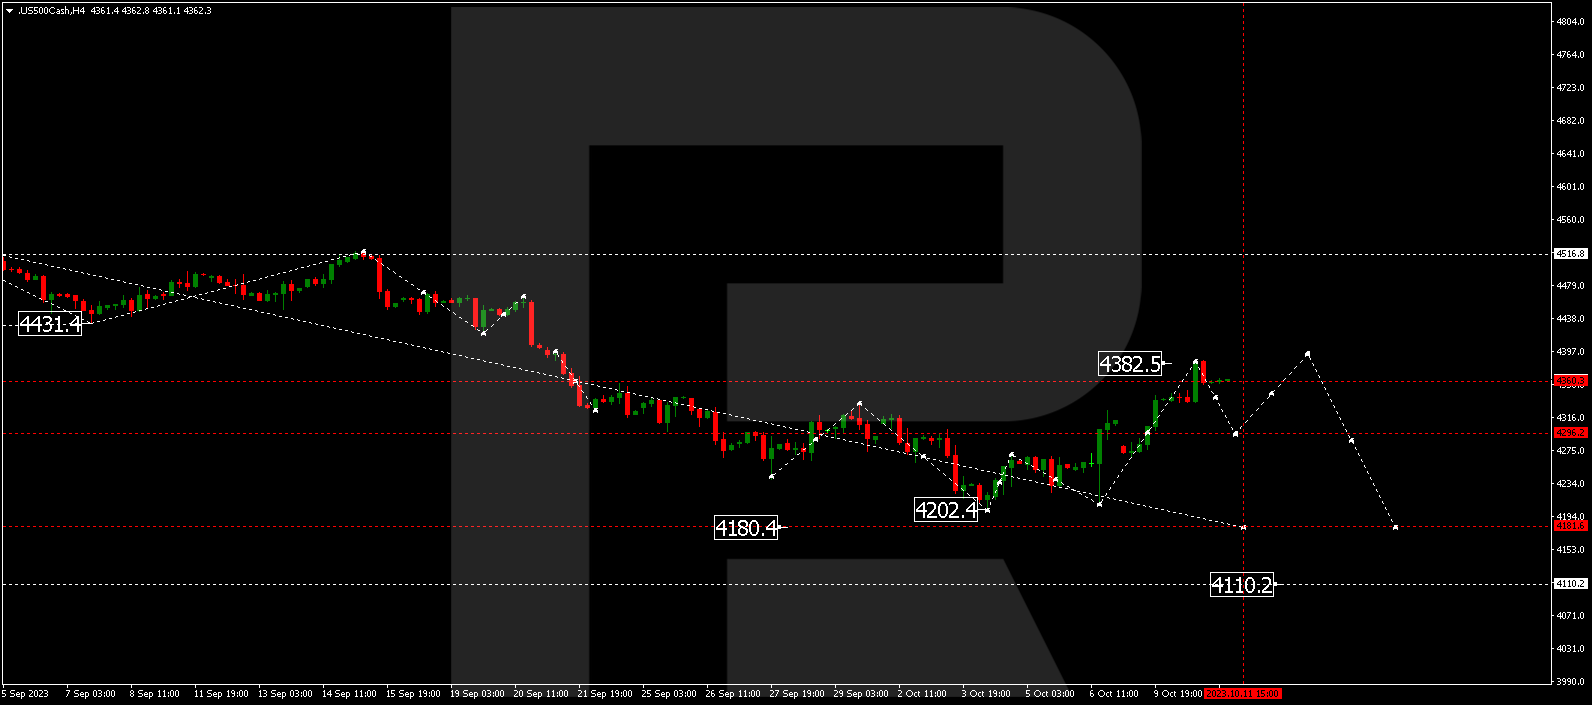
The stock index suggests a correction to 4572.0. When the correction is over, a decline to 4486.6 could start, followed by growth to the 4534.4 level.

