Technical Analysis & Forecast for June 2024
EURUSD, “Euro vs US Dollar”
The EURUSD pair continues to develop a decline wave towards 1.0444, representing the estimated target. Another wave structure targeting 1.0607 and a correction towards 1.0894 have been completed. Today, a consolidation range might form below this level. With a downward breakout, the correction will be considered complete. Subsequently, a decline wave might start, aiming for 1.0675, representing the first target of the next decline wave.


GBPUSD, “Great Britain Pound vs US Dollar”
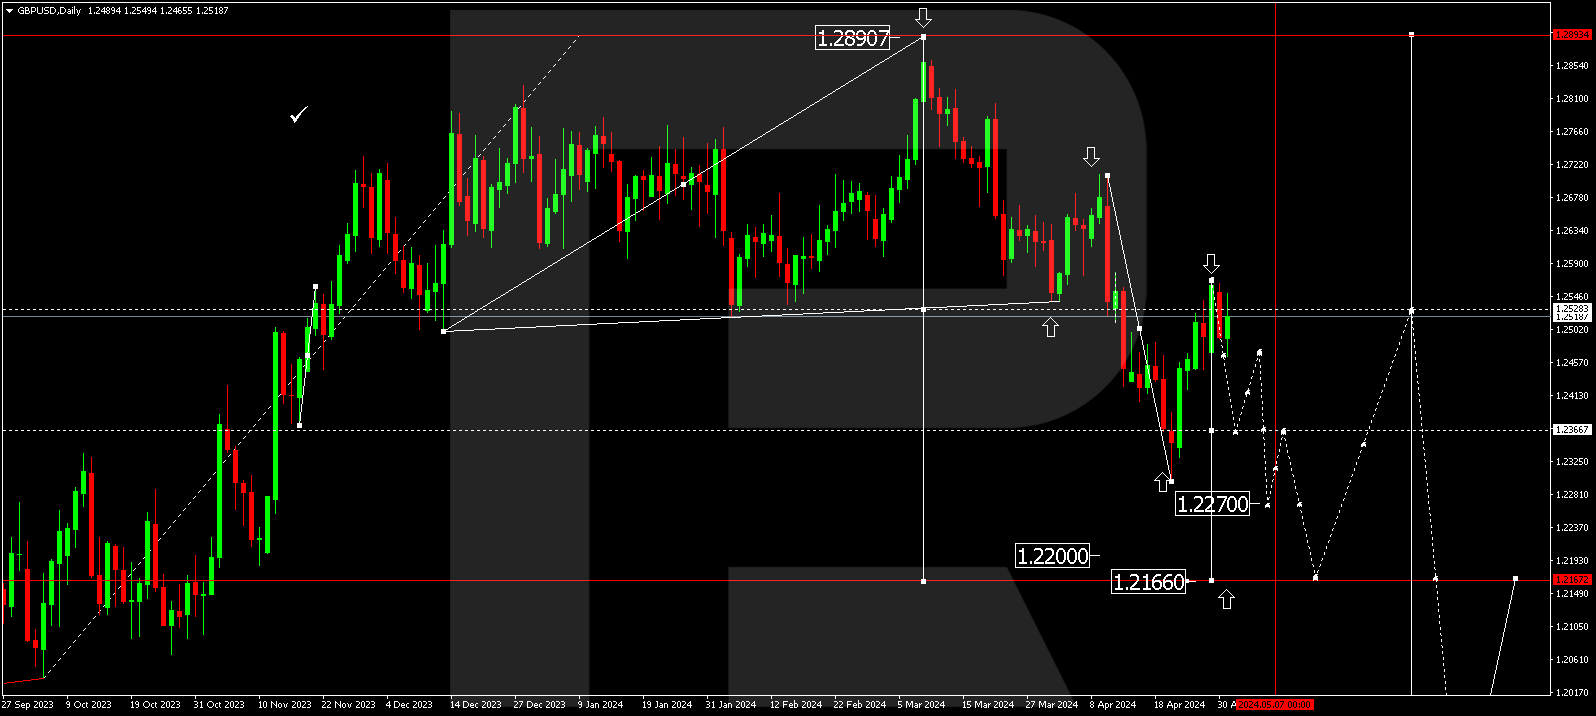
The GBPUSD pair has completed a corrective wave, reaching 1.2797. The market continues to form a consolidation range below this level. With a downward breakout, the correction will be considered complete. Following this, a new decline wave is expected to start, aiming for 1.2550. A downward breakout of this level will open the potential for a decline wave towards 1.2350, representing the first target of the next decline wave.

USDJPY, “US Dollar vs Japanese Yen”
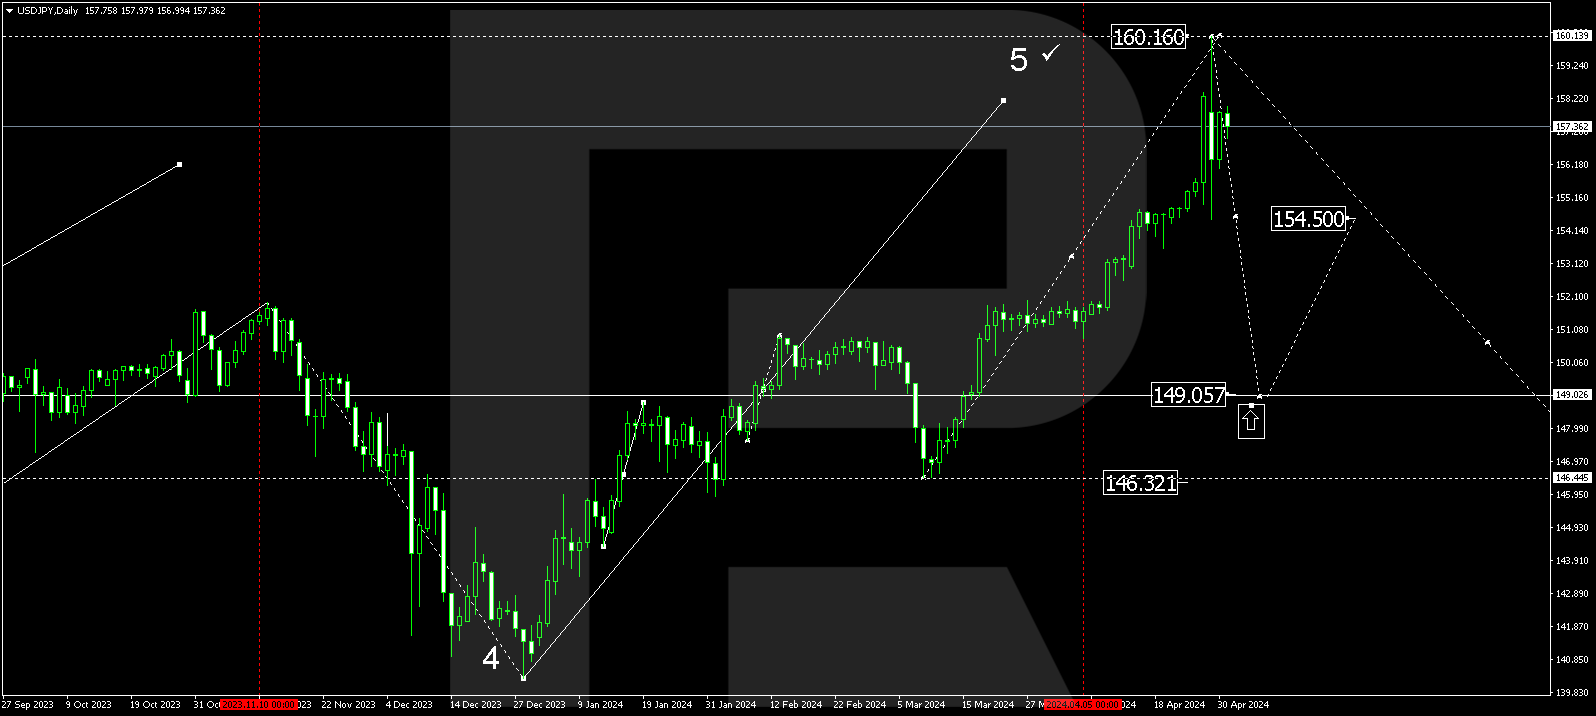
The USDJPY pair is currently in a consolidation phase around 156.00. A rise towards 158.40 is possible, followed by a decline towards 156.00 (testing from above). Subsequently, another growth structure could develop, targeting 160.16. Once the price reaches this level, a new decline wave towards 151.25 might start. With a downward breakout of the range, the wave could continue towards 151.25, potentially expanding to 148.30, the estimated target.

BRENT
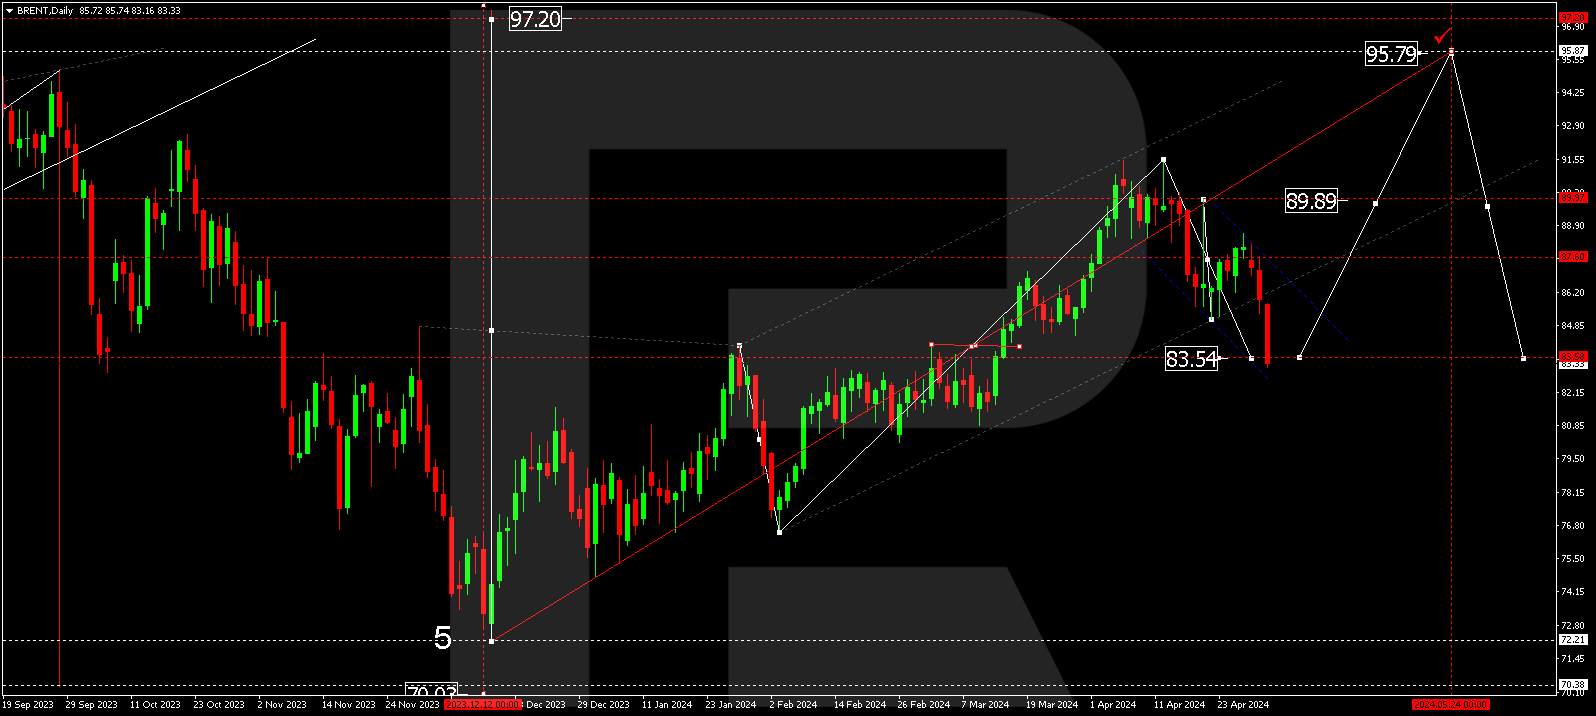
Brent has completed a corrective wave, reaching 81.00. The market continues to form a consolidation range above this level. A downward breakout is possible, with the correction continuing towards 78.00. Following this, a new growth wave might start, aiming for 91.70. With an upward breakout, the price is expected to rise to 88.50, potentially reaching 91.70.

XAUUSD, “Gold vs US Dollar”
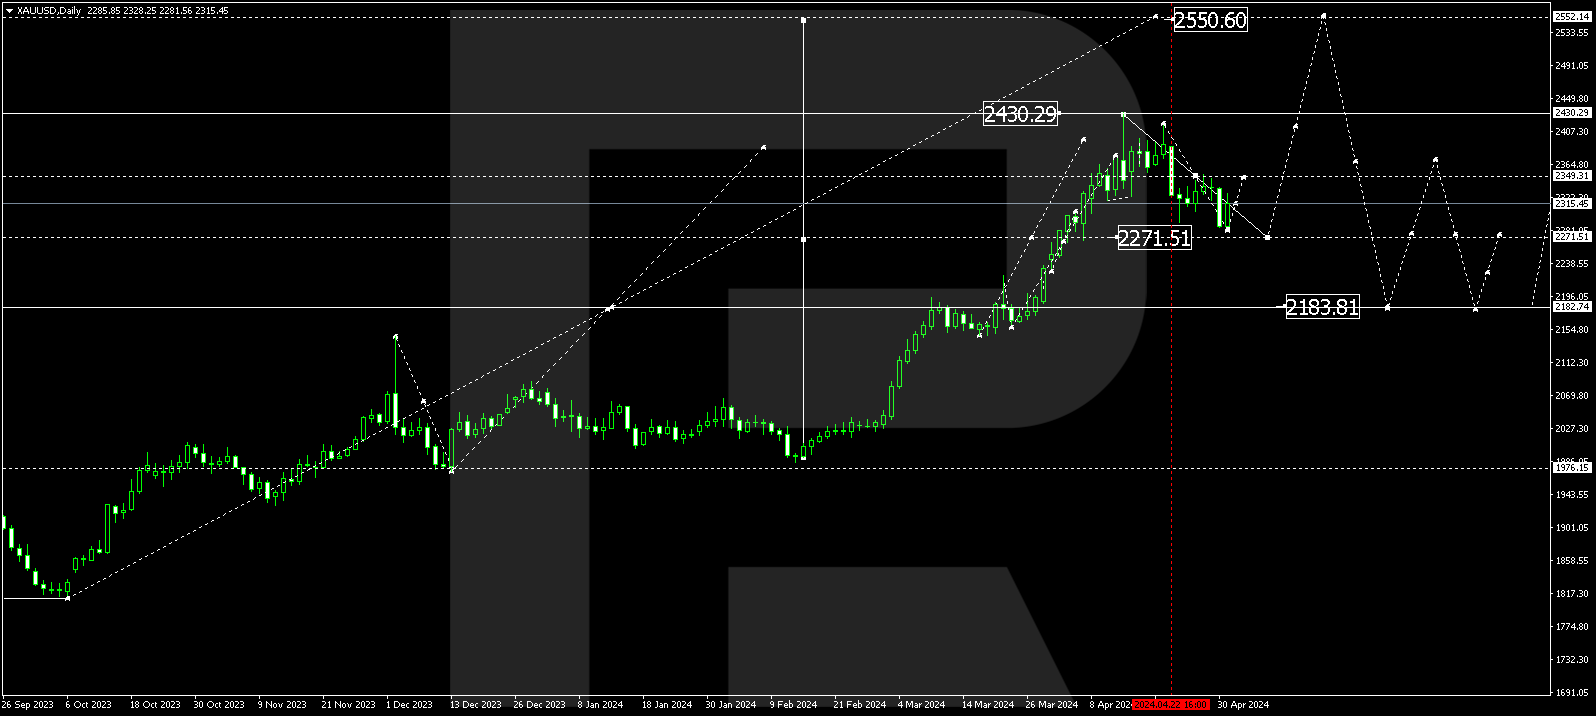
Gold has completed a downward impulse towards 2314.70. Today, a consolidation range is forming above this level. With an upward breakout, a corrective phase could follow, aiming for 2381.70. After this, a new decline wave towards 2212.77 could start. With a downward breakout, the decline wave might expand to 2296.44. If this level also breaks, it will open the potential for a wave towards 2212.70.

S&P 500
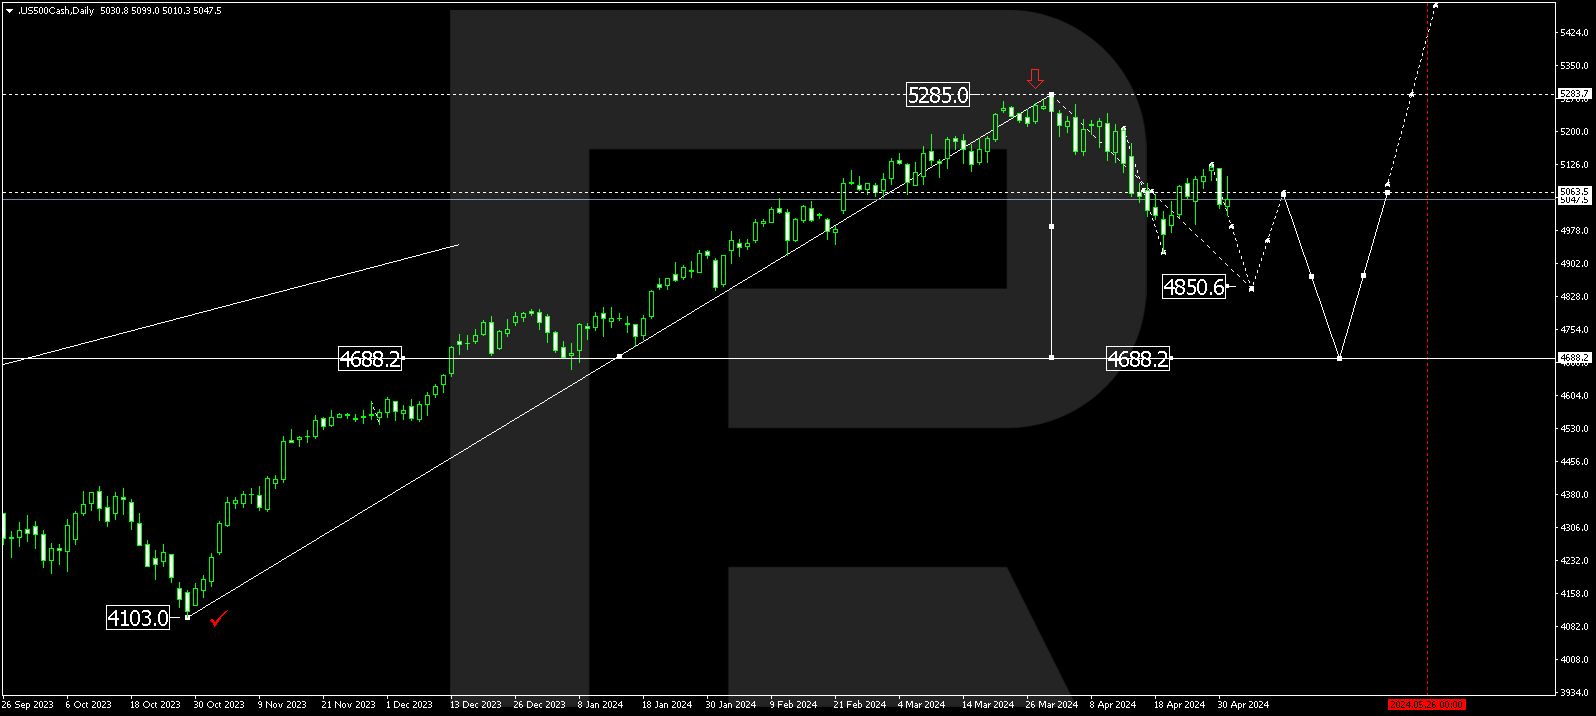
The stock index has formed a consolidation range around 5179.0. With an upward breakout, the price reached a local target of 5344.4. Today, a corrective wave towards 5179.0 (testing from above) is forming. Once the price reaches this level, a new growth structure might start, aiming for 5424.0. After this, a decline wave is expected, aiming for 5063.4 as the first target.
