Technical Analysis & Forecast for September 2023
EURUSD, “Euro vs US Dollar”
The EURUSD pair continues developing the third declining wave. The estimated target is 1.0738. At a certain point, it formed a wave of decline to 1.0675 and a correction to 1.0944 (with a test from below). Today the market continues developing a structure of decline to 1.0738. This is a local target. After the price achieves it, a correction to 1.0944 might follow. Next, a decline to 1.0620 is expected. This is the first target.


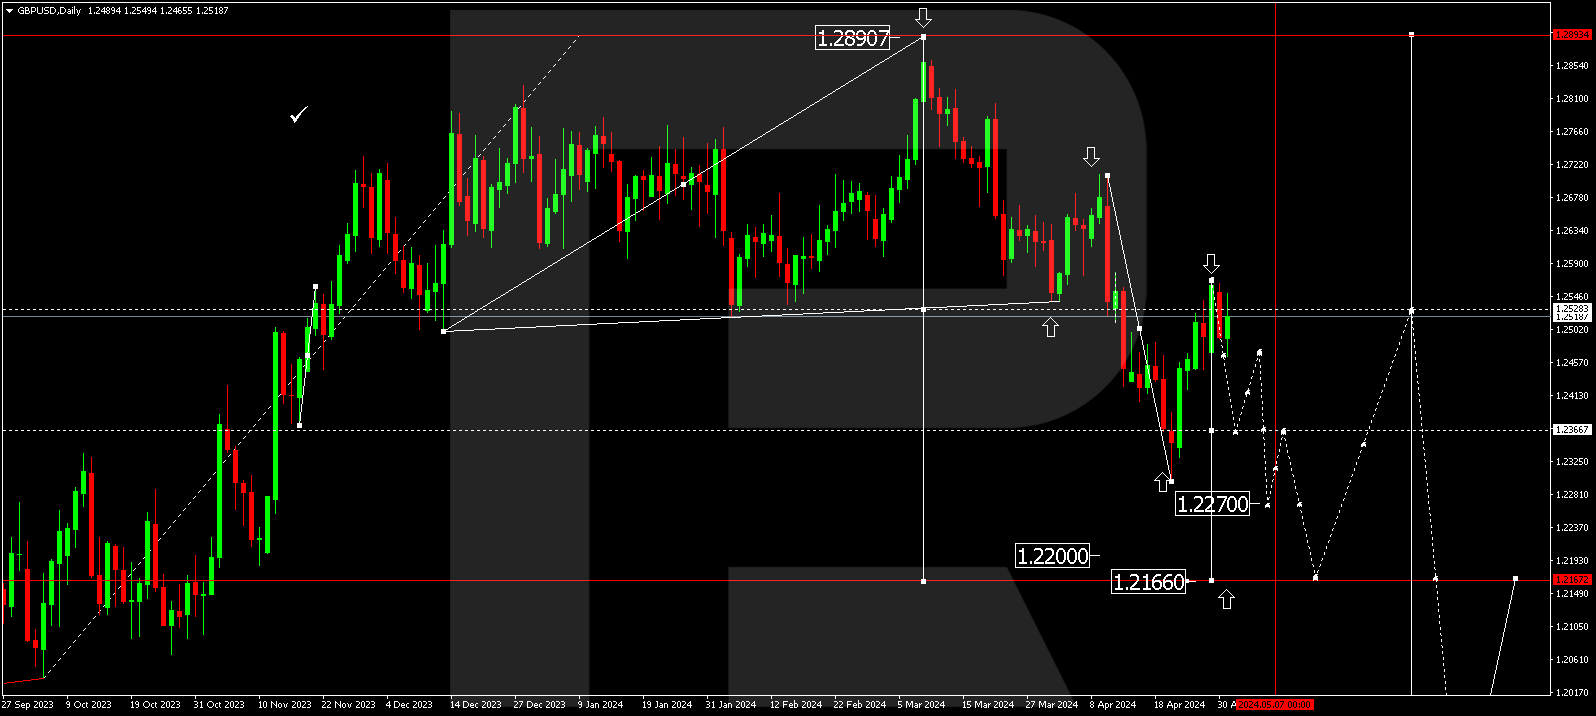
GBPUSD, “Great Britain Pound vs US Dollar”
The GBPUSD pair has formed a wide consolidation range around 1.2717. Today the third wave continues developing to the local target of 1.2444. Once the price reaches this level, a correction to 1.2717 might follow (with a test from below). After it is over, the wave of decline to 1.2299 is expected to continue. This is the first target.

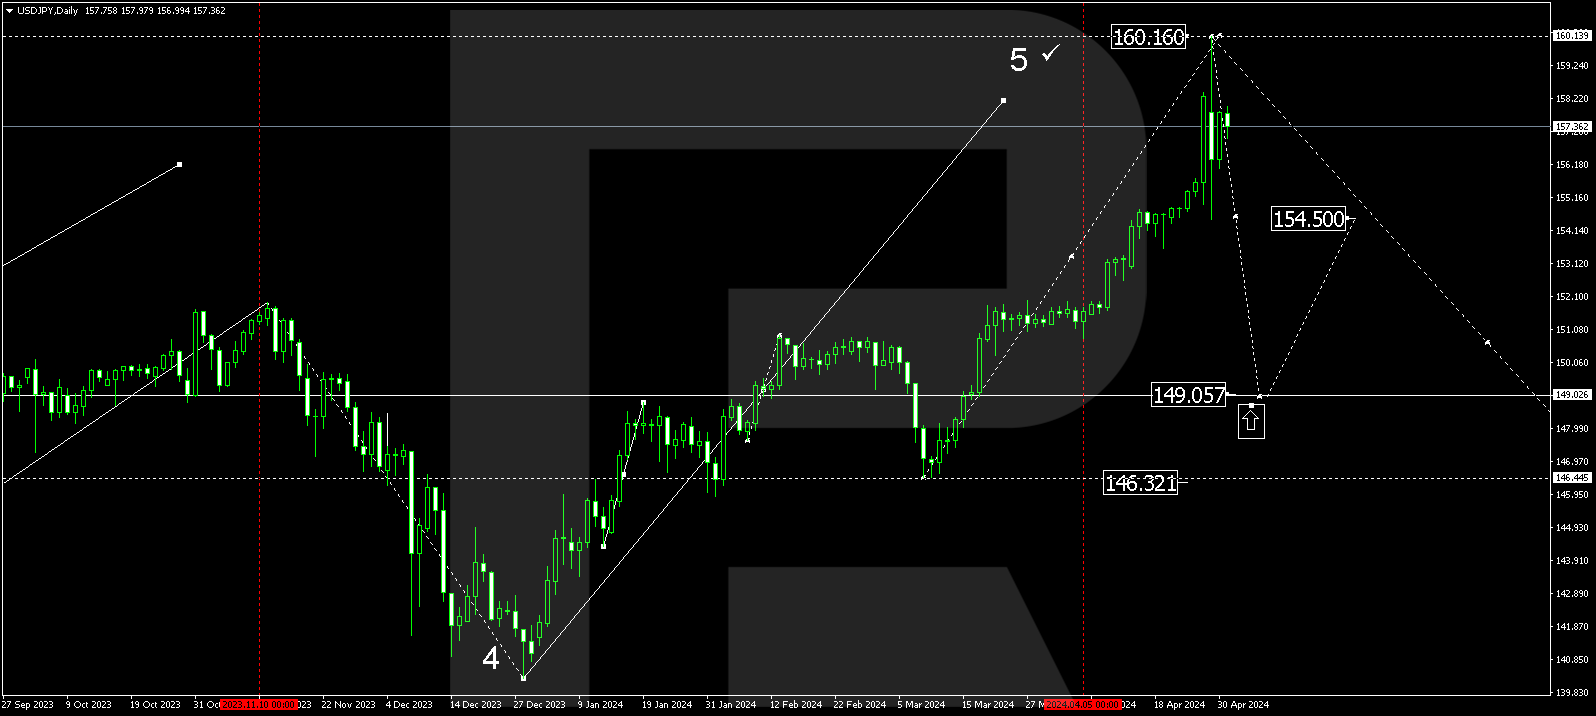
USDJPY, “US Dollar vs Japanese Yen”
The USDJPY pair continues developing a wave of growth to 148.58, at least. At a certain moment, the market formed a link of growth to 147.37. A correction to 144.00 could form today. Once it is over, a new structure of growth might develop to 147.00. An upward breakout of the level might open the potential for a wave of growth to 150.00. This is the main target.

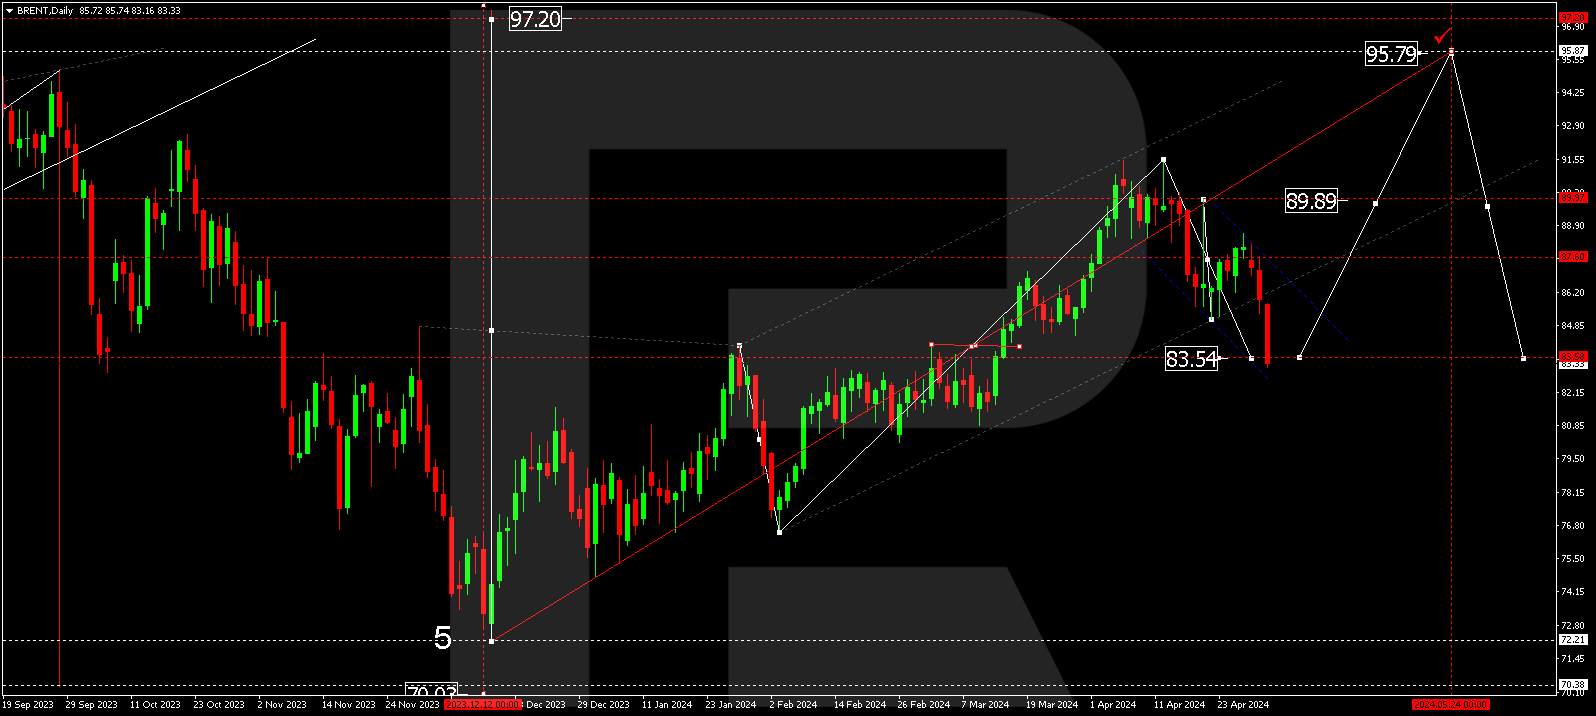
BRENT
Brent completed a wave of growth to 87.55 and corrected to 81.66. Today the market continues developing a structure of growth to 87.55. An upward breakout of this level could open the potential for an ascending wave to 93.55. Once this level is reached, a link of correction to 87.55 is not excluded (with a test from above). Next, a rise to 103.60 could follow. This is a local target.

XAUUSD, “Gold vs US Dollar”
Gold has completed a wave of decline to 1884.74 and a correction to 1948.98. Today the market is forming a consolidation range under this level. A downward escape is expected, after which the wave might continue to 1864.35. Once this level is reached, a correction to 1969.30 could start (a test from below). Next, a new wave of decline to 1837.00 might develop. A downward breakout of the level might end in extension of the trend to 1705.00.

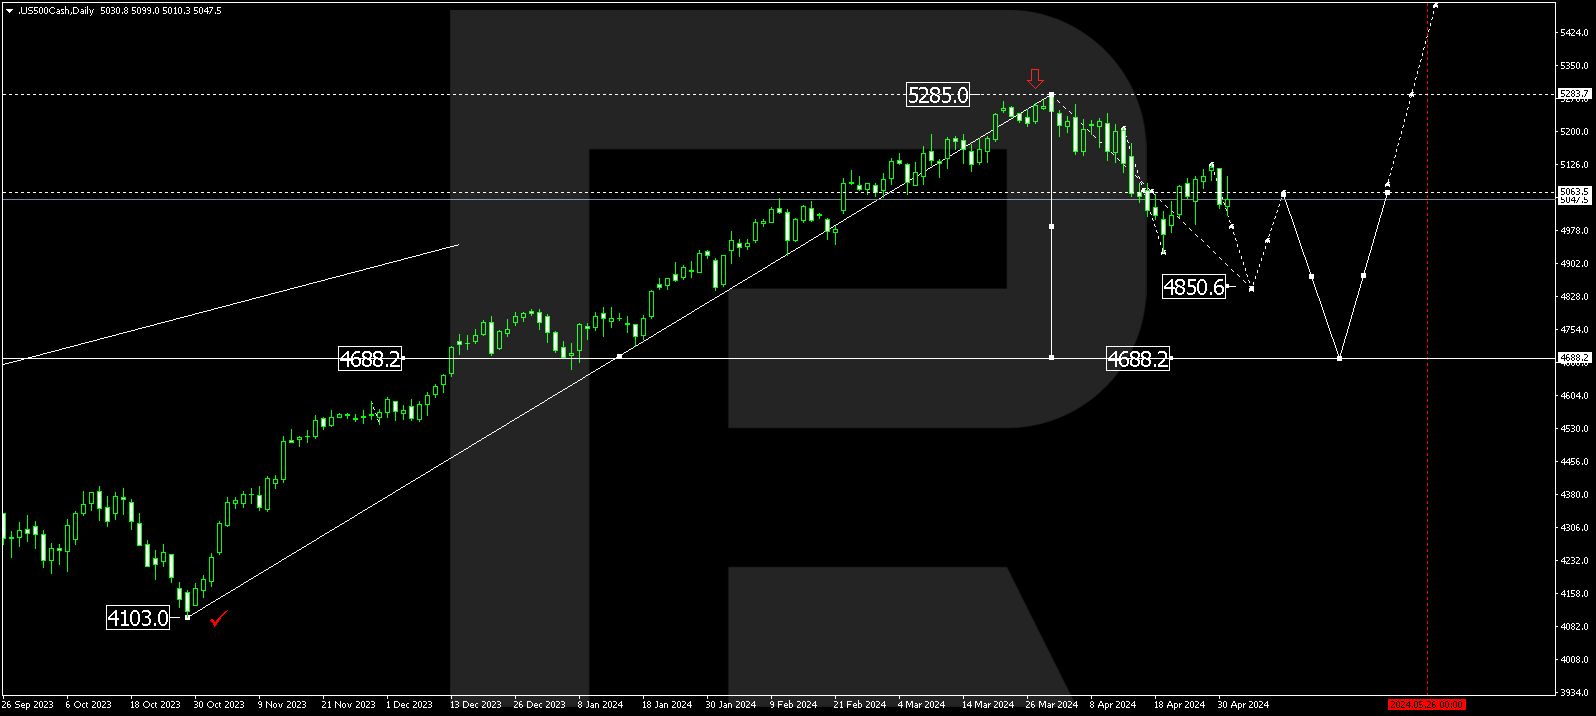
S&P 500
The stock index performed the first declining impulse to 4336.7 and a correction to 4534.0. Today the wave of decline might extend to 4333.3. And a downward breakout of this level could open the potential for a decline to 4134.0. Once this level is reached, a link of correction to 4333.3 is not excluded (with a test from below). Next, a decline to 4050.0 might follow. This is the first target.
