US 500 analysis: sellers hold the key resistance level
The US 500 index is testing the resistance level for the fourth trading session. Find out more in our US 500 forecast for next week.
US 500 forecast: key trading points
- The US 500 index is testing the resistance level for the fourth consecutive trading session, indicating pressure from sellers
- Jerome Powell emphasised the need to ease monetary policy and highlighted threats to the employment market if current elevated interest rates are maintained
- Investors are awaiting initial jobless claims data due on Thursday and the July consumer spending report scheduled for Friday
- Resistance: 5,650.0, Support: 5,615.0
- US 500 price forecast: 5,678.0 and 5,745.0
Fundamental analysis
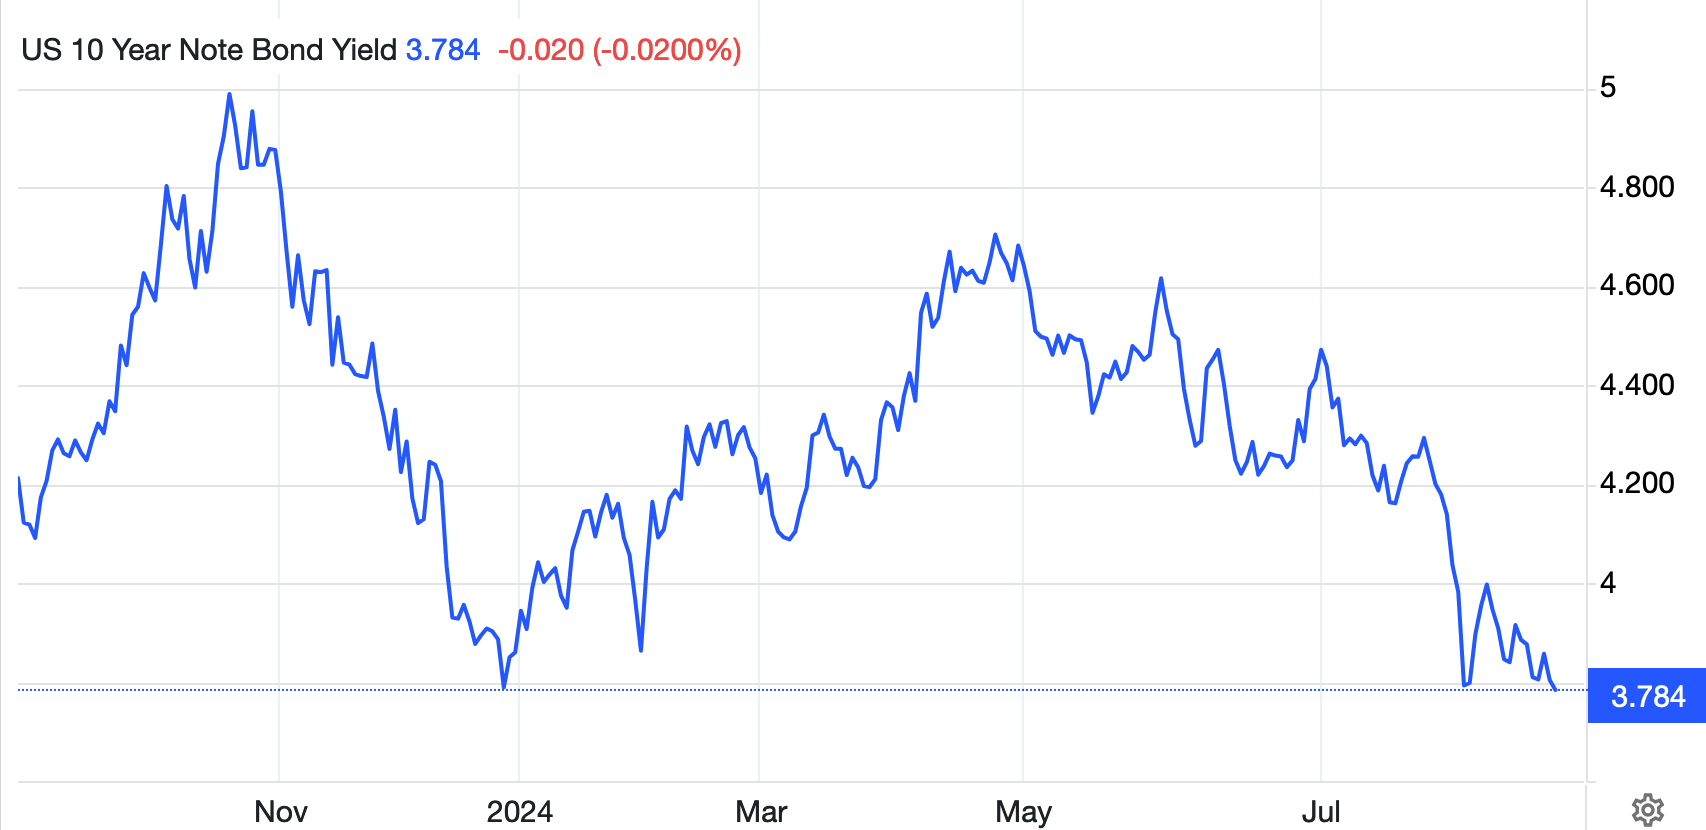
On Monday, investors in the US stock market adopted a wait-and-see approach. Despite the recent decline caused by dovish comments from the Fed chair, the yield on 10-year US treasury bonds is relatively high.
Source: https://tradingeconomics.com/united-states/government-bond-yield
In his speech, Jerome Powell clearly outlined the necessity for easing the monetary policy. He stressed that maintaining the current elevated interest rates poses serious risks to the employment market while inflation has already slowed enough to approach the 2% target. Therefore, Powell made it clear that an interest rate cut is inevitable.
The market expected Powell to provide more specific guidelines on the pace of interest rate cuts. However, analysts believe his statements do not justify an overly aggressive 50-basis-point reduction.
Investors are awaiting the initial jobless claims data due on Thursday to assess the employment market, and a July consumer spending report scheduled for Friday. These data may significantly impact the US 500 index forecast.
US 500 technical analysis
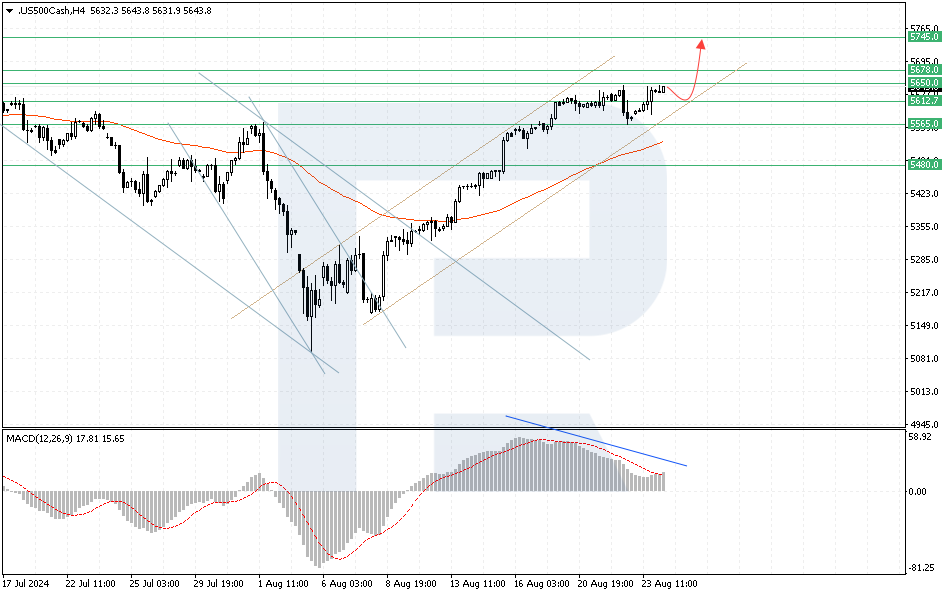
The US 500 index continues to test the crucial 5,650.0 resistance level. A breakout above this level will open the way to a high of 5,678.0. Currently, a restraining factor for buyers is a bearish divergence on the MACD indicator, which may cause a correction towards the lower boundary of the ascending channel at 5,615.0. After this signal is completed, another growth wave is expected to begin, aiming for 5,745.0. As the US 500 analysis shows, a negative scenario for buyers will be a breakout below the lower boundary of the ascending channel, with the price securing below 5.565.0. In this case, the target for a downward correction could be at the 5,480.0 level.
Key US 500 levels to watch include:
- Resistance level: 5,650.0 – if the price breaks above this level, it could target 5,678.0
- Support level: 5.565.0 – a breakout below this level will signal a trend reversal, with the target at 5,480.0
Summary
Despite Jerome Powell indicating the need for monetary policy easing, investors expect more specific signals regarding the pace of interest rate cuts. Data on initial jobless claims and consumer spending will help clarify further market expectations. Technical analysis and the US 500 forecast for next week suggest a slight correction towards 5,615.0, followed by further growth to the 5,678.0 and 5,745.0 targets.


