US Tech analysis: decline paused but is not over
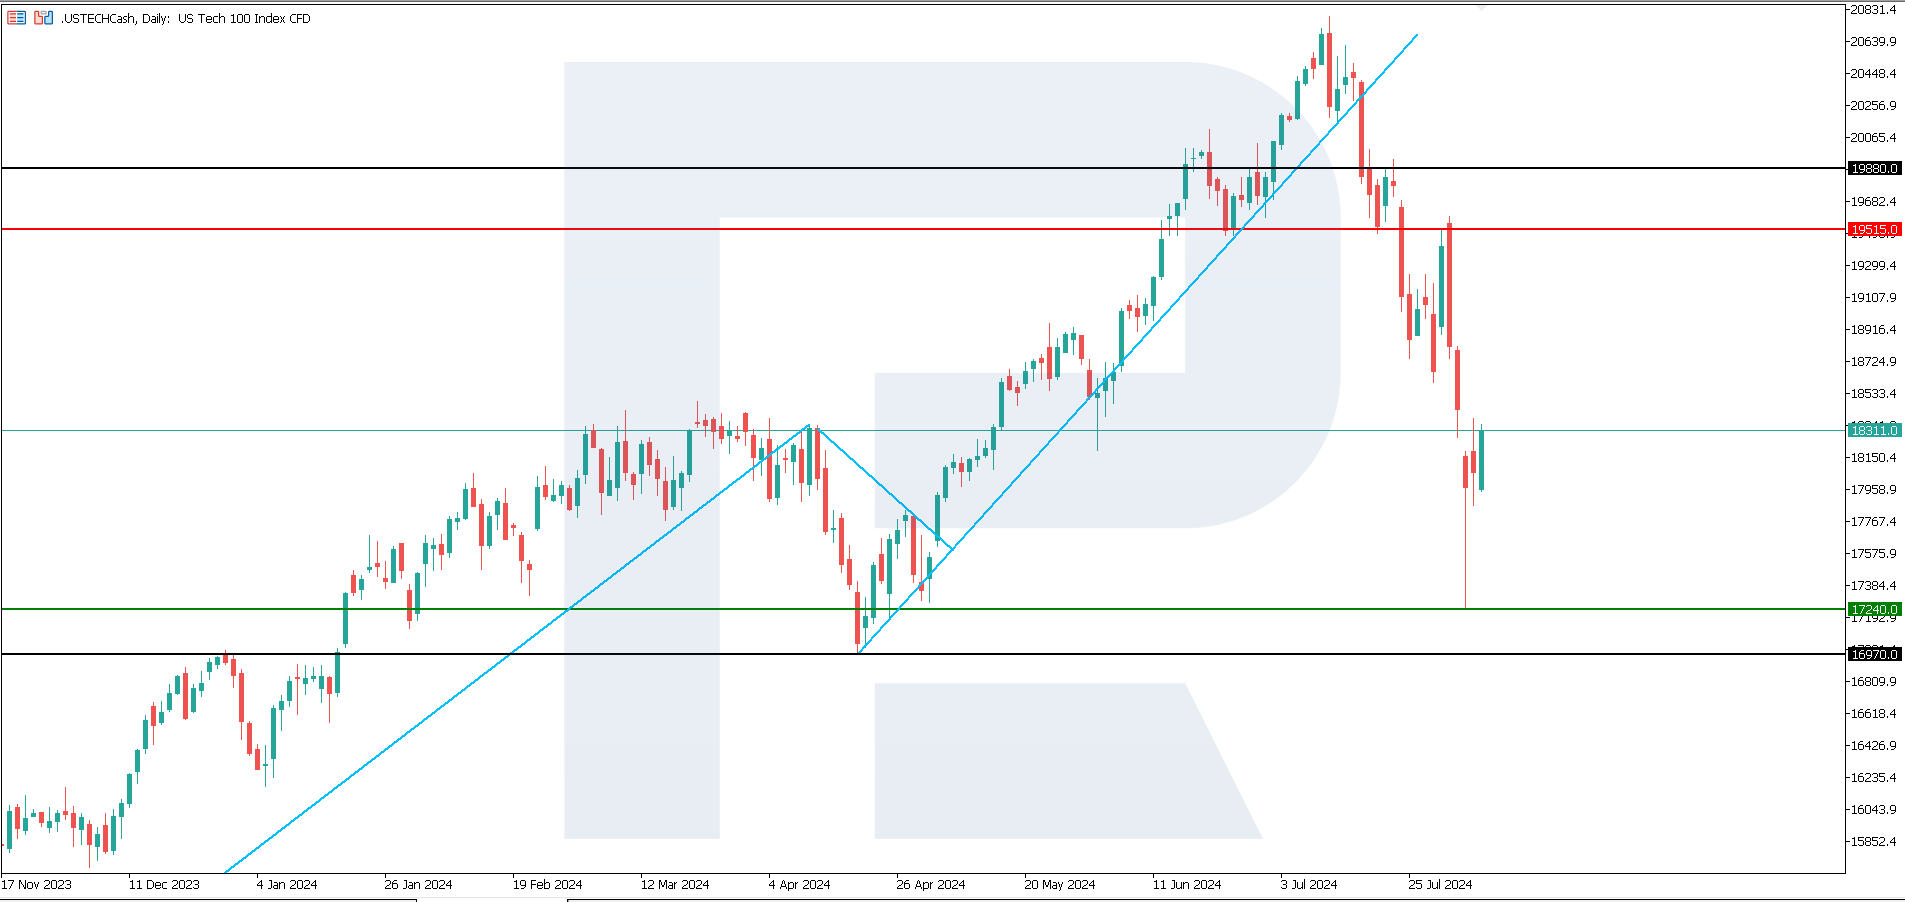
The US Tech stock index established a support level at 17,240.0 at the close of Tuesday’s trading session. However, according to the US Tech index forecast, the decline is not over yet.
US Tech trading key points
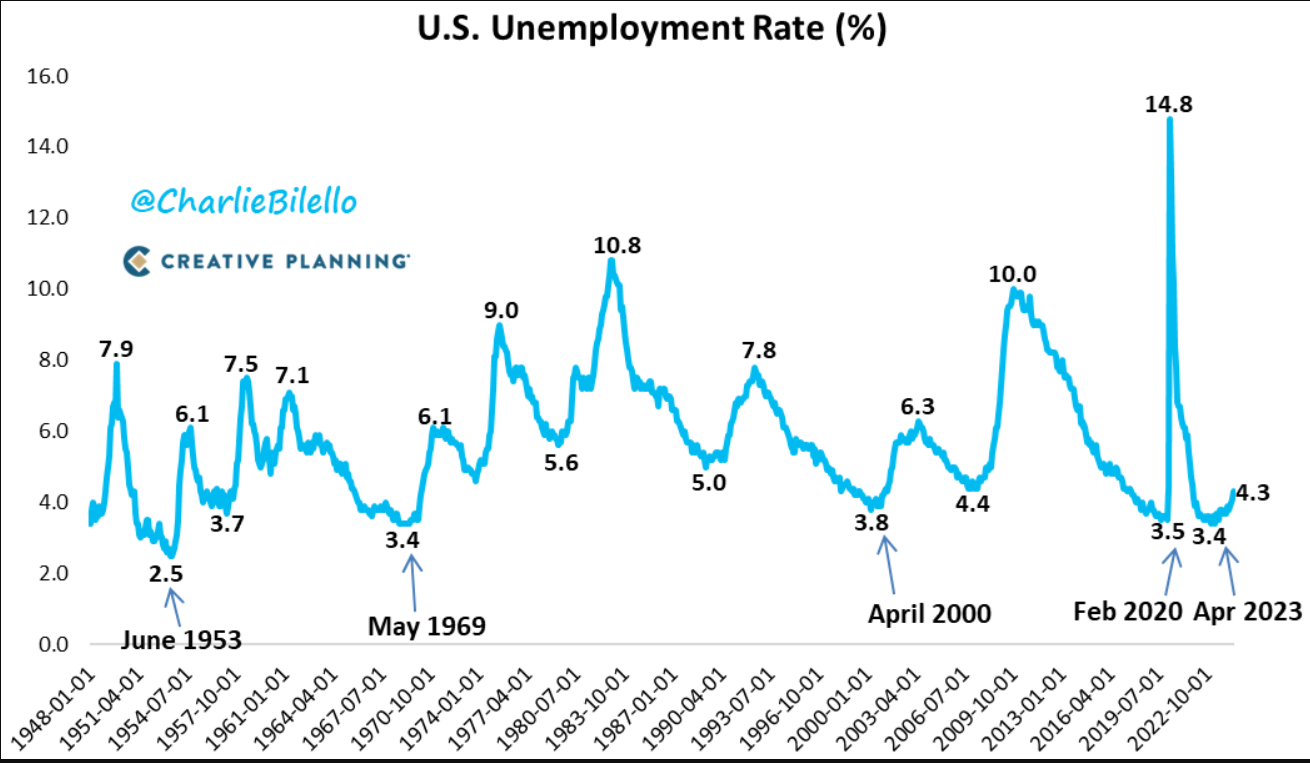
- Recent data: the US unemployment rate rose to 4.3% in July, marking the highest reading since October 2021
- Economic indicators: the unemployment rate is one of the crucial indicators for the US Federal Reserve in determining monetary policy
- Market impact: the released data may prompt the Fed to lower interest rates more decisively
- Resistance: 19,515.0, Support: 17,240.0
- US Tech price forecast: 16,970.0
Fundamental analysis
The US unemployment rate rose to 4.3% in July, exceeding analysts’ forecast of 4.1%. Notably, this figure is significantly below the all-time average of 5.7%, and the current level is 0.9% above the cyclical low reached in April 2023 (3.4%). Historically, recessions have, on average, begun three months before a similar 0.9% increase in the unemployment rate.
Source: https://bilello.blog/2024/the-week-in-charts-8-5-24
In mid-July, US stocks clearly did not reflect a recession scenario as they rose to their highest levels since 2000. In this context, investors questioned whether the US Federal Reserve’s current policy, with its elevated key rate, aligns with economic realities.
Market participants expect the regulator to act more decisively in lowering interest rates to prevent a recession. For this reason, investors seek to invest their available funds in government bonds before rates are reduced, which will diminish their profitability. This process is ongoing, so the US Tech forecast for next week remains negative.
US Tech technical analysis
The US Tech stock index is in a downtrend. A significant correction has been underway since Tuesday after the index fell by over 6%. However, this does not indicate a trend reversal, as the gap between the current support and resistance levels is substantial. Typically, a decline continues after a correction in such scenarios.
Key levels for the US Tech price forecast:
- Resistance level: 19,515.0 – with an upward breakout, the price could reach 19,880.0
- Support level: 17,240.0 – if the price breaks below the support level, the index could tumble to 16,970.0
Summary
The US Tech stock index established a support level at 17,240.0 as part of a correction. However, the decline will continue given the uncertainty surrounding the Federal Reserve’s key rate policy and investors’ desire to lock in yields on US government bonds, the decline will continue. According to the US Tech analysis, the 16,970.0 level will become the next target for the decline.


