EUR/USD
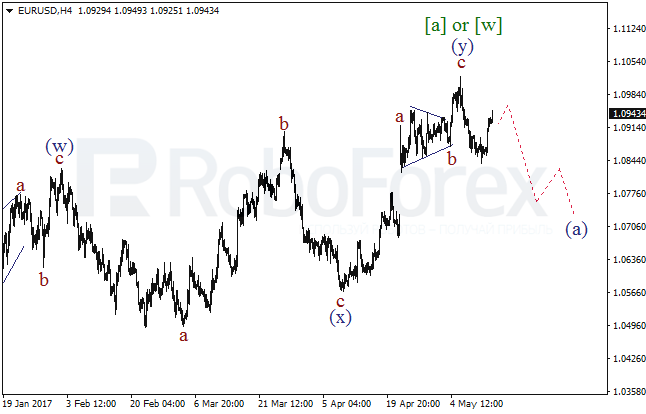
After the double zigzag [a] or [w] was over, a descending impulse in the direction of the wave (а) was formed. As a result, when the local correction is over, we may see how the market resumes its downward movement and breaks below the last low.
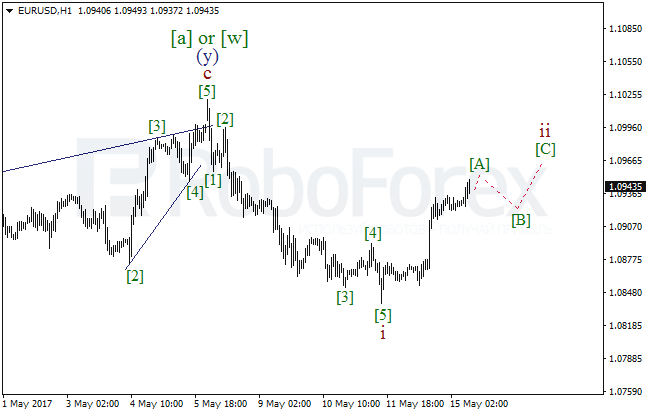
A more detailed explanation is shown on the H1 chart. After the descending impulse within the wave i was over, a correction began. Consequently, later we may see the wave ii moving further, and this will probably become a zigzag.
GBP/USD
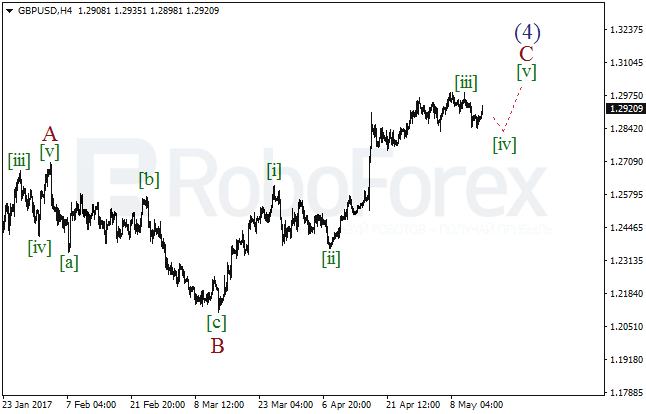
Probably, the extension within the wave [iii] was over, and a new descending correction is in progress now within the wave [iv]. In the coming days we may see how the market continues consolidating. Afterwards we won't exclude the market being rising further within the wave [v] of C.
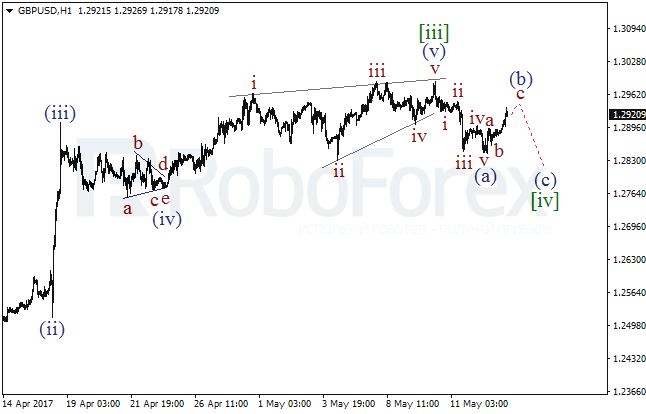
The wave (а) on the H1 chart shows a descending impulse. In the course of Monday, the zigzag within the wave (b) may be over. Correspondingly, the pair may resume moving downwards within the wave (c) of [iv].
USD/JPY
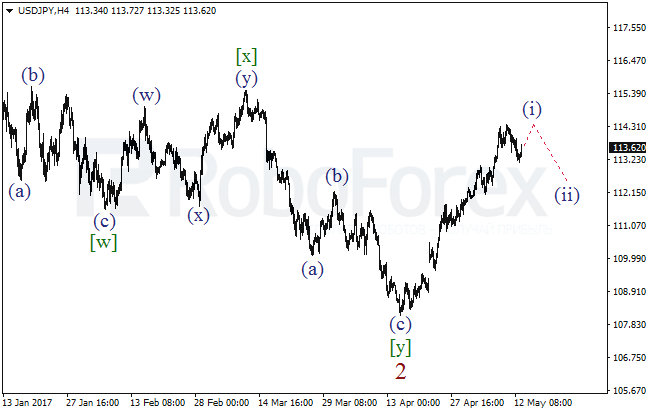
The bullish impulse withing the wave (i) is coming to its end. In the near term, the price can rise and form a new high, but soon after that we may see a start of a descending correction - the wave (ii).
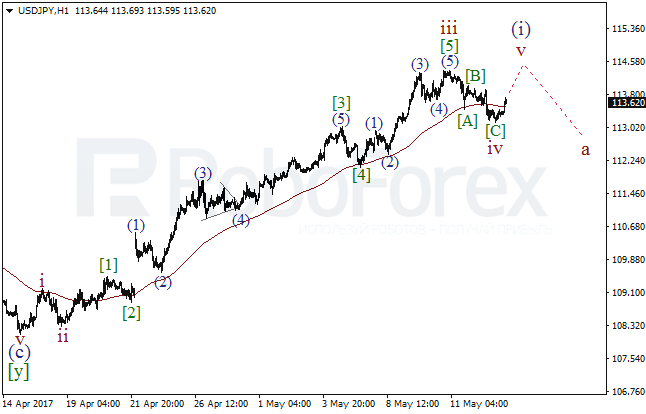
On the H1 chart the market is trying to hold above the Moving Average line suggesting that the wave iv may soon be over. As a result, later we may see a yet another bullish impulse within the wave v of (i).
AUD/USD
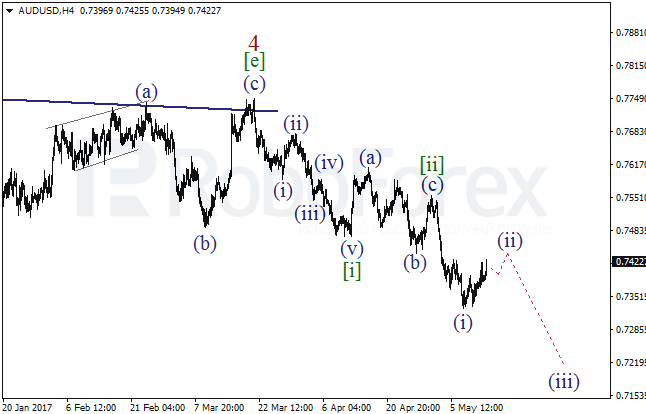
It is not improbable that the descending extension within the wave [iii] with a second wave is being formed. Earlier we saw a flat within the wave [ii]. In the near term, after the correction is over, we may see how the markets continues moving downwards within the wave (iii) of [iii].
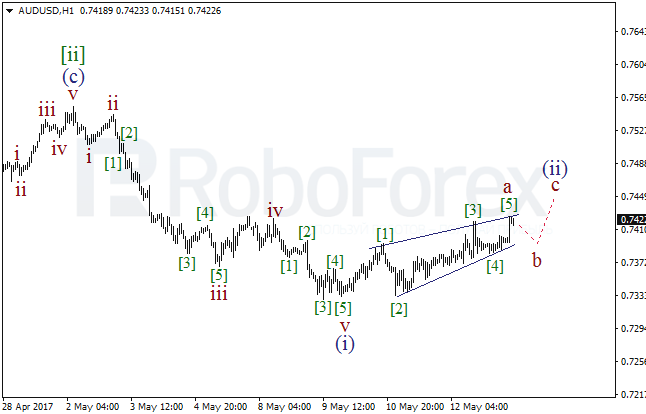
Admittedly, on the H1 chart a wedge is being completed within the wave a of (ii). As such, after a local correction we may see a yet another bullish impulse within the wave c of (ii).