EUR USD
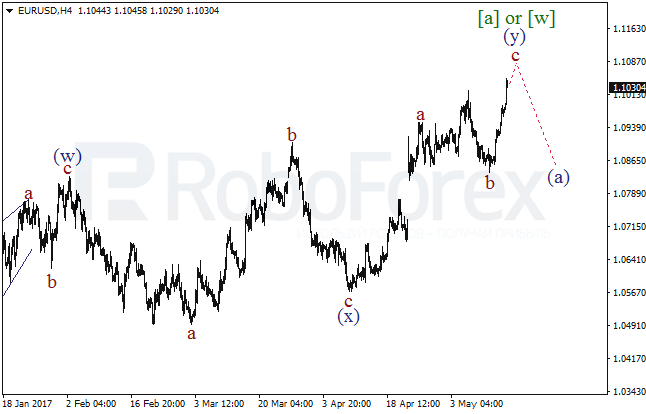
A double zigzag within the wave [a] of [w] continues to form. As a result, in a few coming hours we can see the ascending impulse come to an end within the wave с of (y). If a descending impulse in the direction of the wave (а) is formed, this will be seen as a confirmation of a further rise.
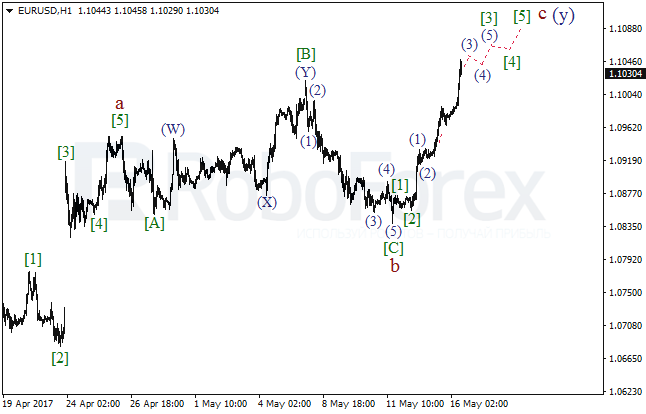
A more detailed picture can be seen on the H1 chart. Admittedly, an extension within the wave [3] of c is formed. Chances are in the course of Tuesday the price will continue moving upwards, but after that it can show a correction.
GBP USD
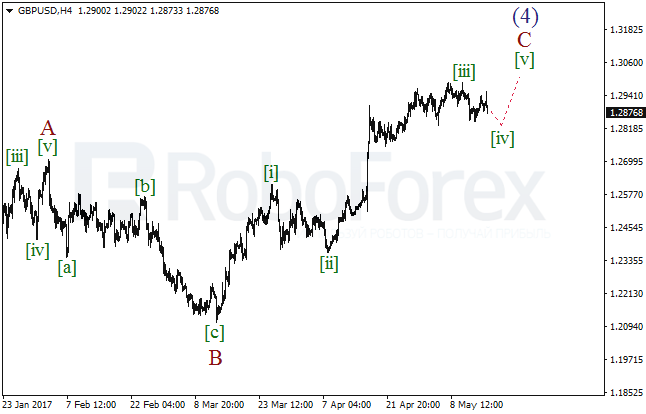
Admittedly, the extension within the wave [iii] has come to an end and a descending correction in the wave [iv] is in place now. In the coming days we can see the consolidation range continue. After that we can probably see a further rise within the wave [v] of C.
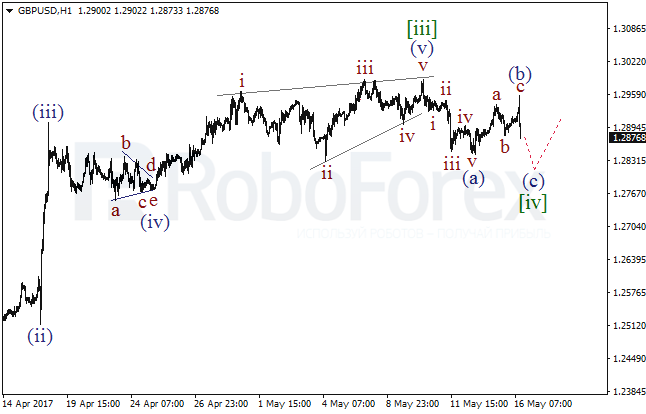
On the H1 chart, within the wave (а) a descending impulse has been formed which was corrected by a zigzag of the wave (b). Correspondingly, the pair can continue declining within the wave (c) of [iv].
USD JPY
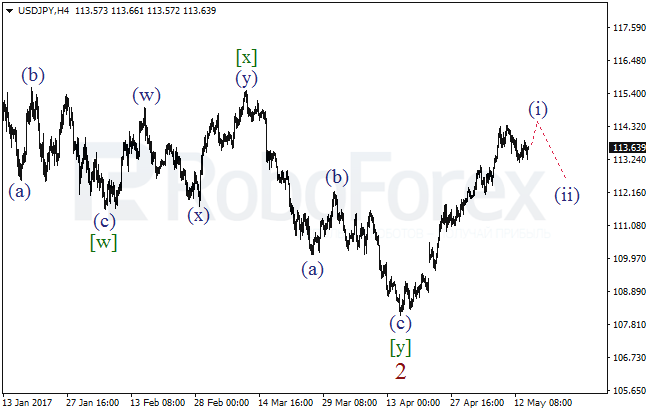
The bullish impuse within the wave (i) has almost come to an end. In the near term, the price can still hit a new local high, but soon after that it can start a descending correction move - the wave (ii).
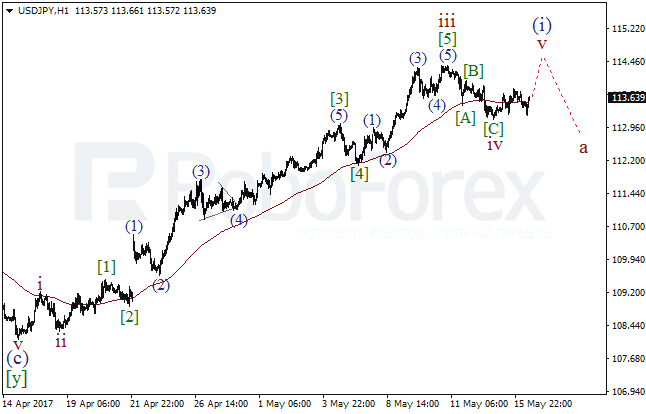
Most probably the wave iv has come to an end forming a zigzag. Earlier a long extension within the wave iii was formed. Consequently, later we can see a yet another bullish impulse within the wave v of (i).
AUD USD
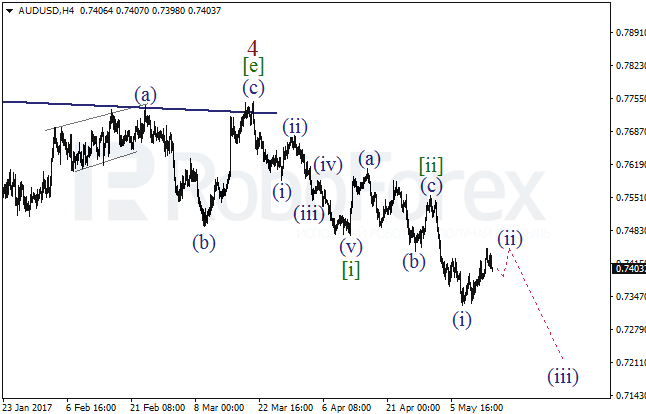
A descending extension is being formed within the wave [iii] which has the second wave within. In the near term, after the correction is over, we can see how the pair resumes declining within the wave (iii) of [iii]. Consequently, in the near term we can see a new low of the wave (i).
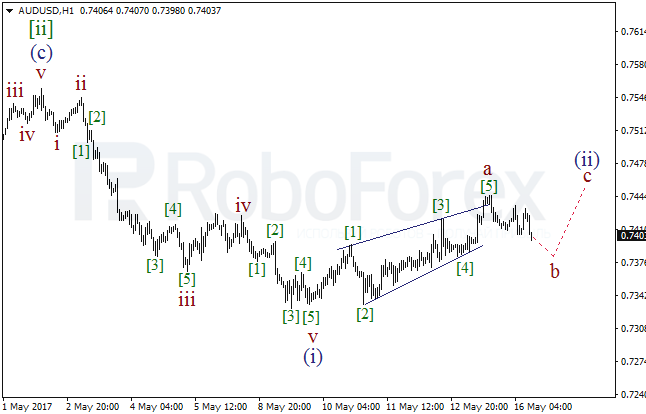
On the H1 chart the wedge has been comleted in the wave a of (ii). As such, after the wave b has been completed, we can see a yet another bullish impulse or diagonal triangle within the wave c of (ii).