EUR USD, “Euro vs US Dollar”
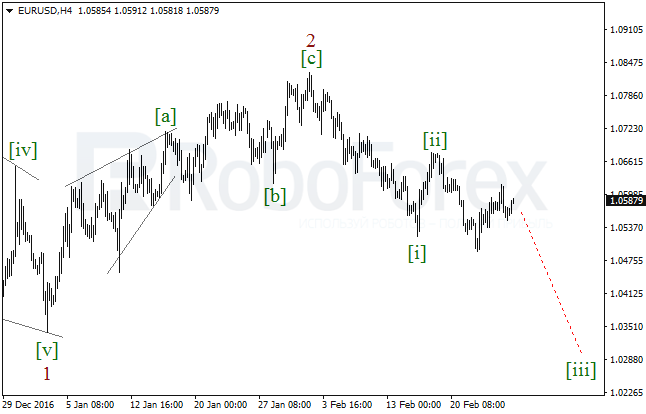
It looks like the EUR/USD pair is forming the extension in the wave [iii]. Earlier, the price completed the descending impulse in the wave [i]. Consequently, after finishing the local correction, the market may resume moving downwards.
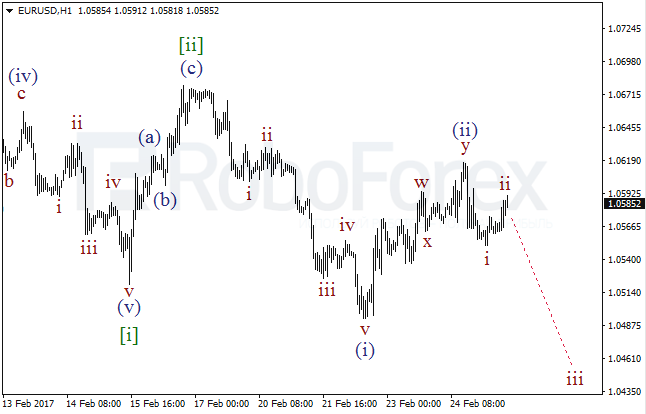
As we can see at the H1 chart, the pair probably completed the double zigzag and, as a result, started falling in the wave i. Consequently, after finishing the wave ii, the market may continue falling in the wave iii of (iii).
GBP USD, “Great Britain Pound vs US Dollar”
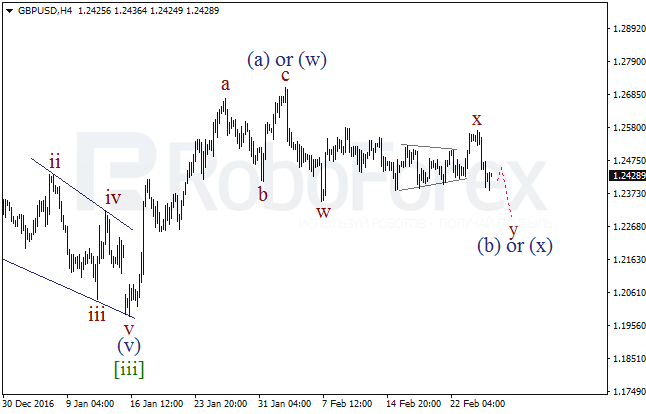
In case of the GBP/USD pair, the price is still forming the wave (b) or (x). Earlier, the pair completed the double three in the wave x. As a result, in the nearest future the market may resume form the descending zigzag in the wave y.
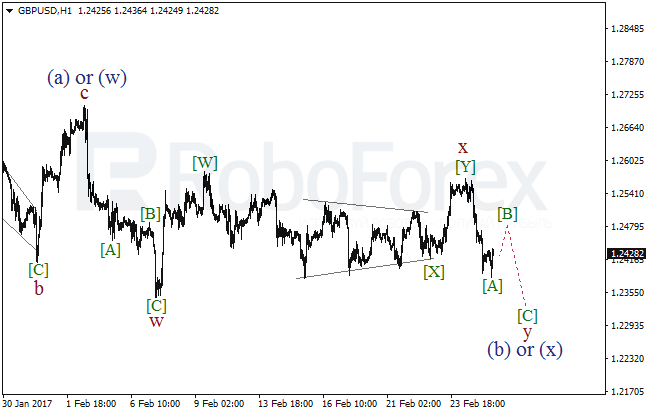
At the H1 chart, after finishing the wave x, the pair formed the bearish impulse in the wave [A]. On Monday the market may be corrected, but later the price is expected to resume falling in the wave [C] of y.
USD JPY, “US Dollar vs Japanese Yen”
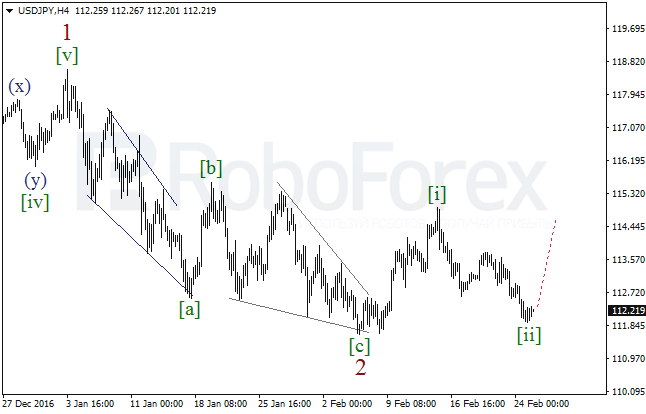
Possibly, after finishing the wave 2 and the bullish impulse in the wave [i], the USD/JPY pair completed the wave [ii]. As a result, later the market may resume moving upwards to reach the local high.
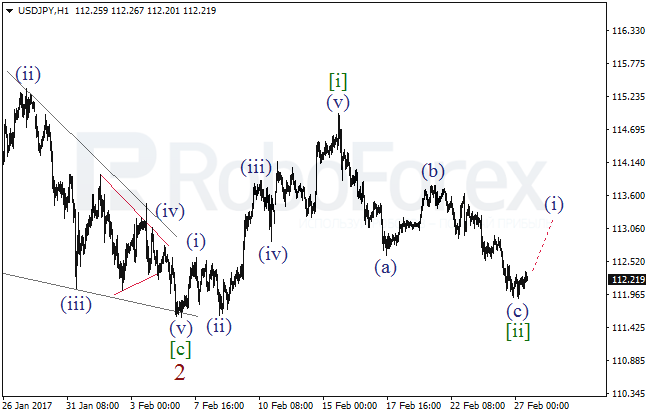
At the H1 chart, the pair completed the descending impulse in the wave (c) in the zigzag [ii]. To confirm a new growth, the market has to form the bullish impulse in the wave (i).
AUD USD, “Australian Dollar vs US Dollar”
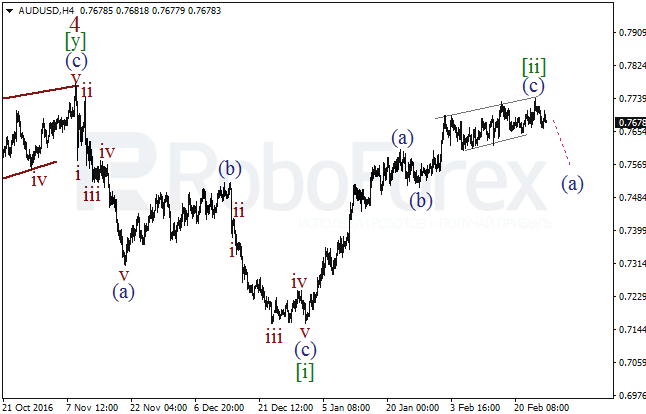
In case of the AUD/USD pair, the main scenario still implies that the price finished the zigzag in the wave [ii]. Consequently, in the nearest future the market may resume falling and form the descending impulse in the wave (a) of [iii].
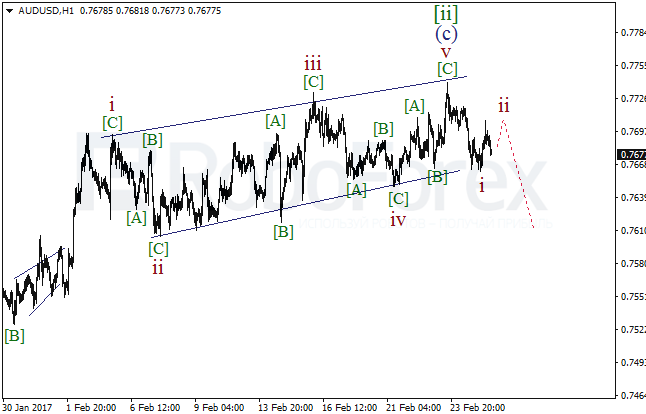
More detailed structure is shown on the H1 chart. The pair completed the fifth wave in the diagonal triangle (c) and then formed the impulse in the wave i. As a result, after finishing the wave ii, the market may resume moving downwards.
RoboForex Analytical Department