Weekly technical analysis and forecast (7–11 July 2025)
In this weekly technical analysis, we examine key chart patterns and levels for the pairs EURUSD, USDJPY, GBPUSD, AUDUSD, USDCAD, as well as for gold (XAUUSD) and Brent crude oil, in order to forecast market developments for the upcoming week (7–11 July 2025).
Major technical levels to watch this week
- EURUSD: Support: 1.1444–1.1240. Resistance: 1.1850–1.1900
- USDJPY: Support: 142.00–136.30. Resistance: 145.00–151.20
- GBPUSD: Support: 1.3440–1.2940. Resistance: 1.3660–1.4000
- AUDUSD: Support: 0.6533–0.6200. Resistance: 0.6677–0.6800
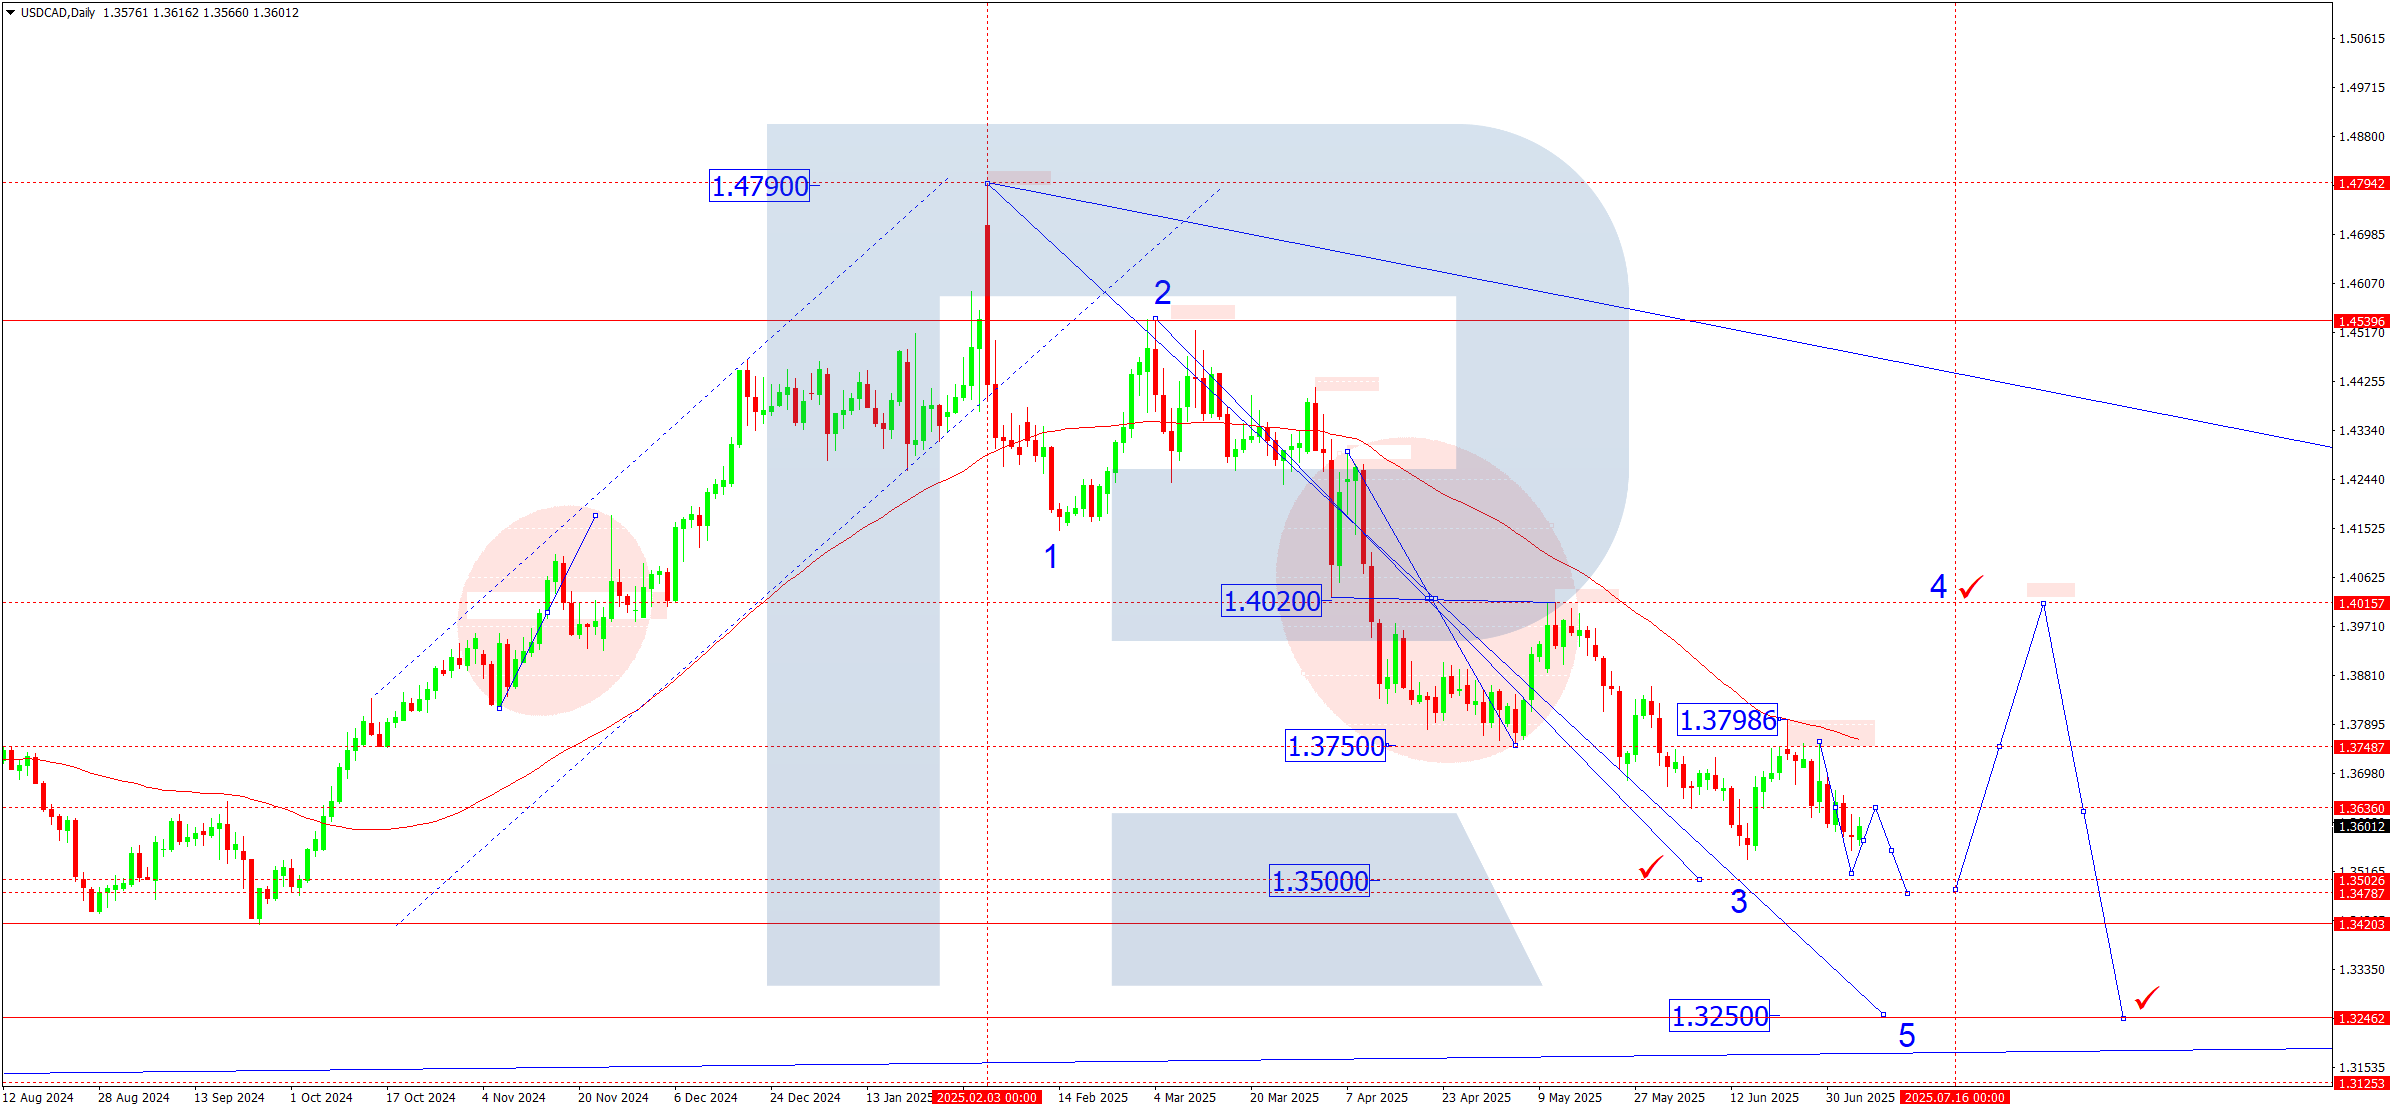
- USDCAD: Support: 1.3500–1.3470. Resistance: 1.3750–1.4000
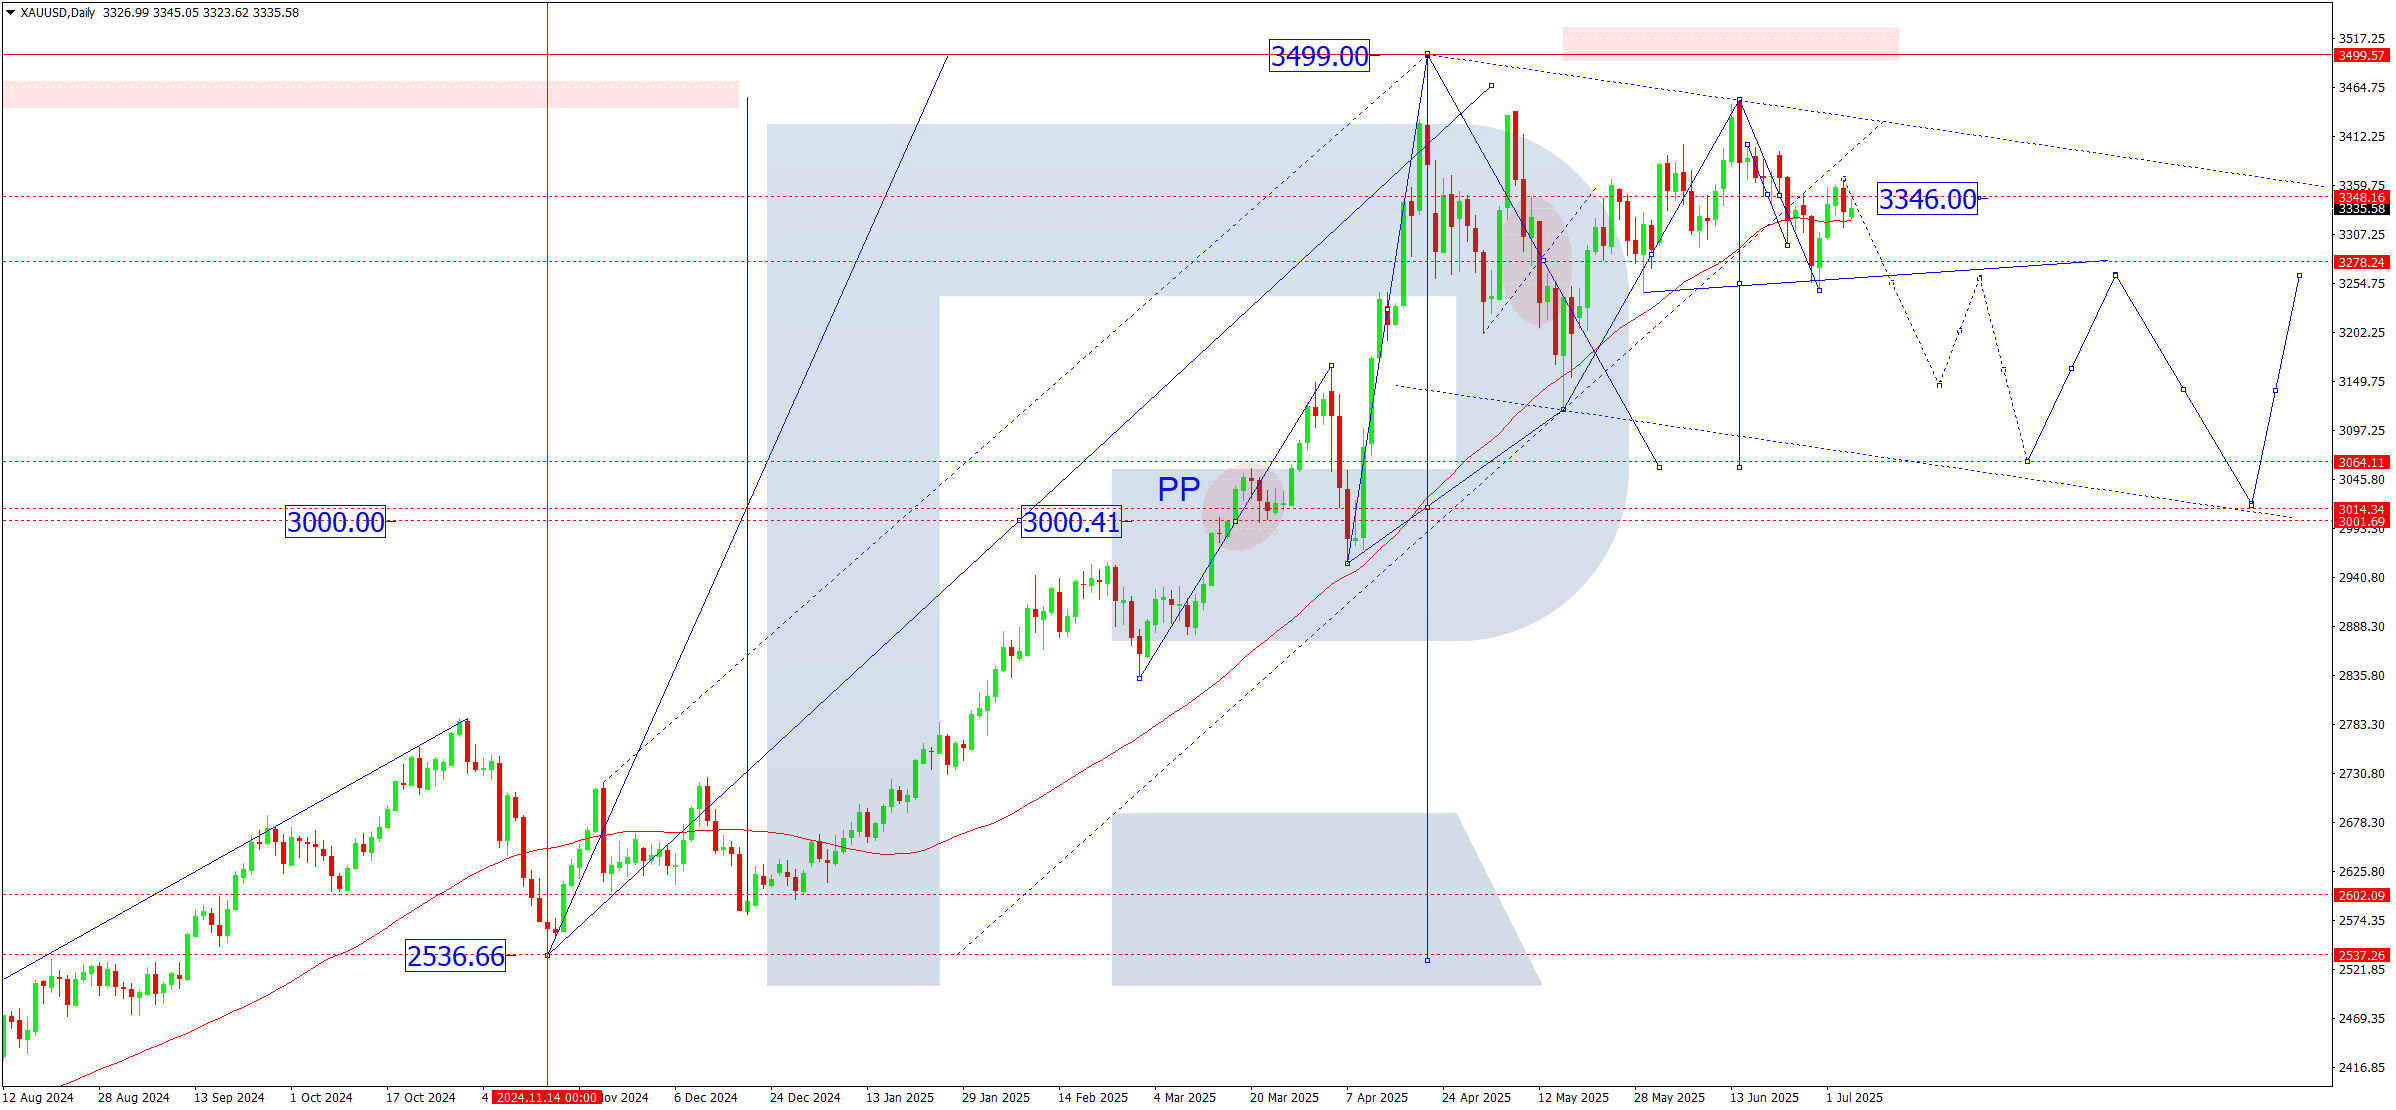
- Gold: Support: 3,350–3,000. Resistance: 3,450–4,000
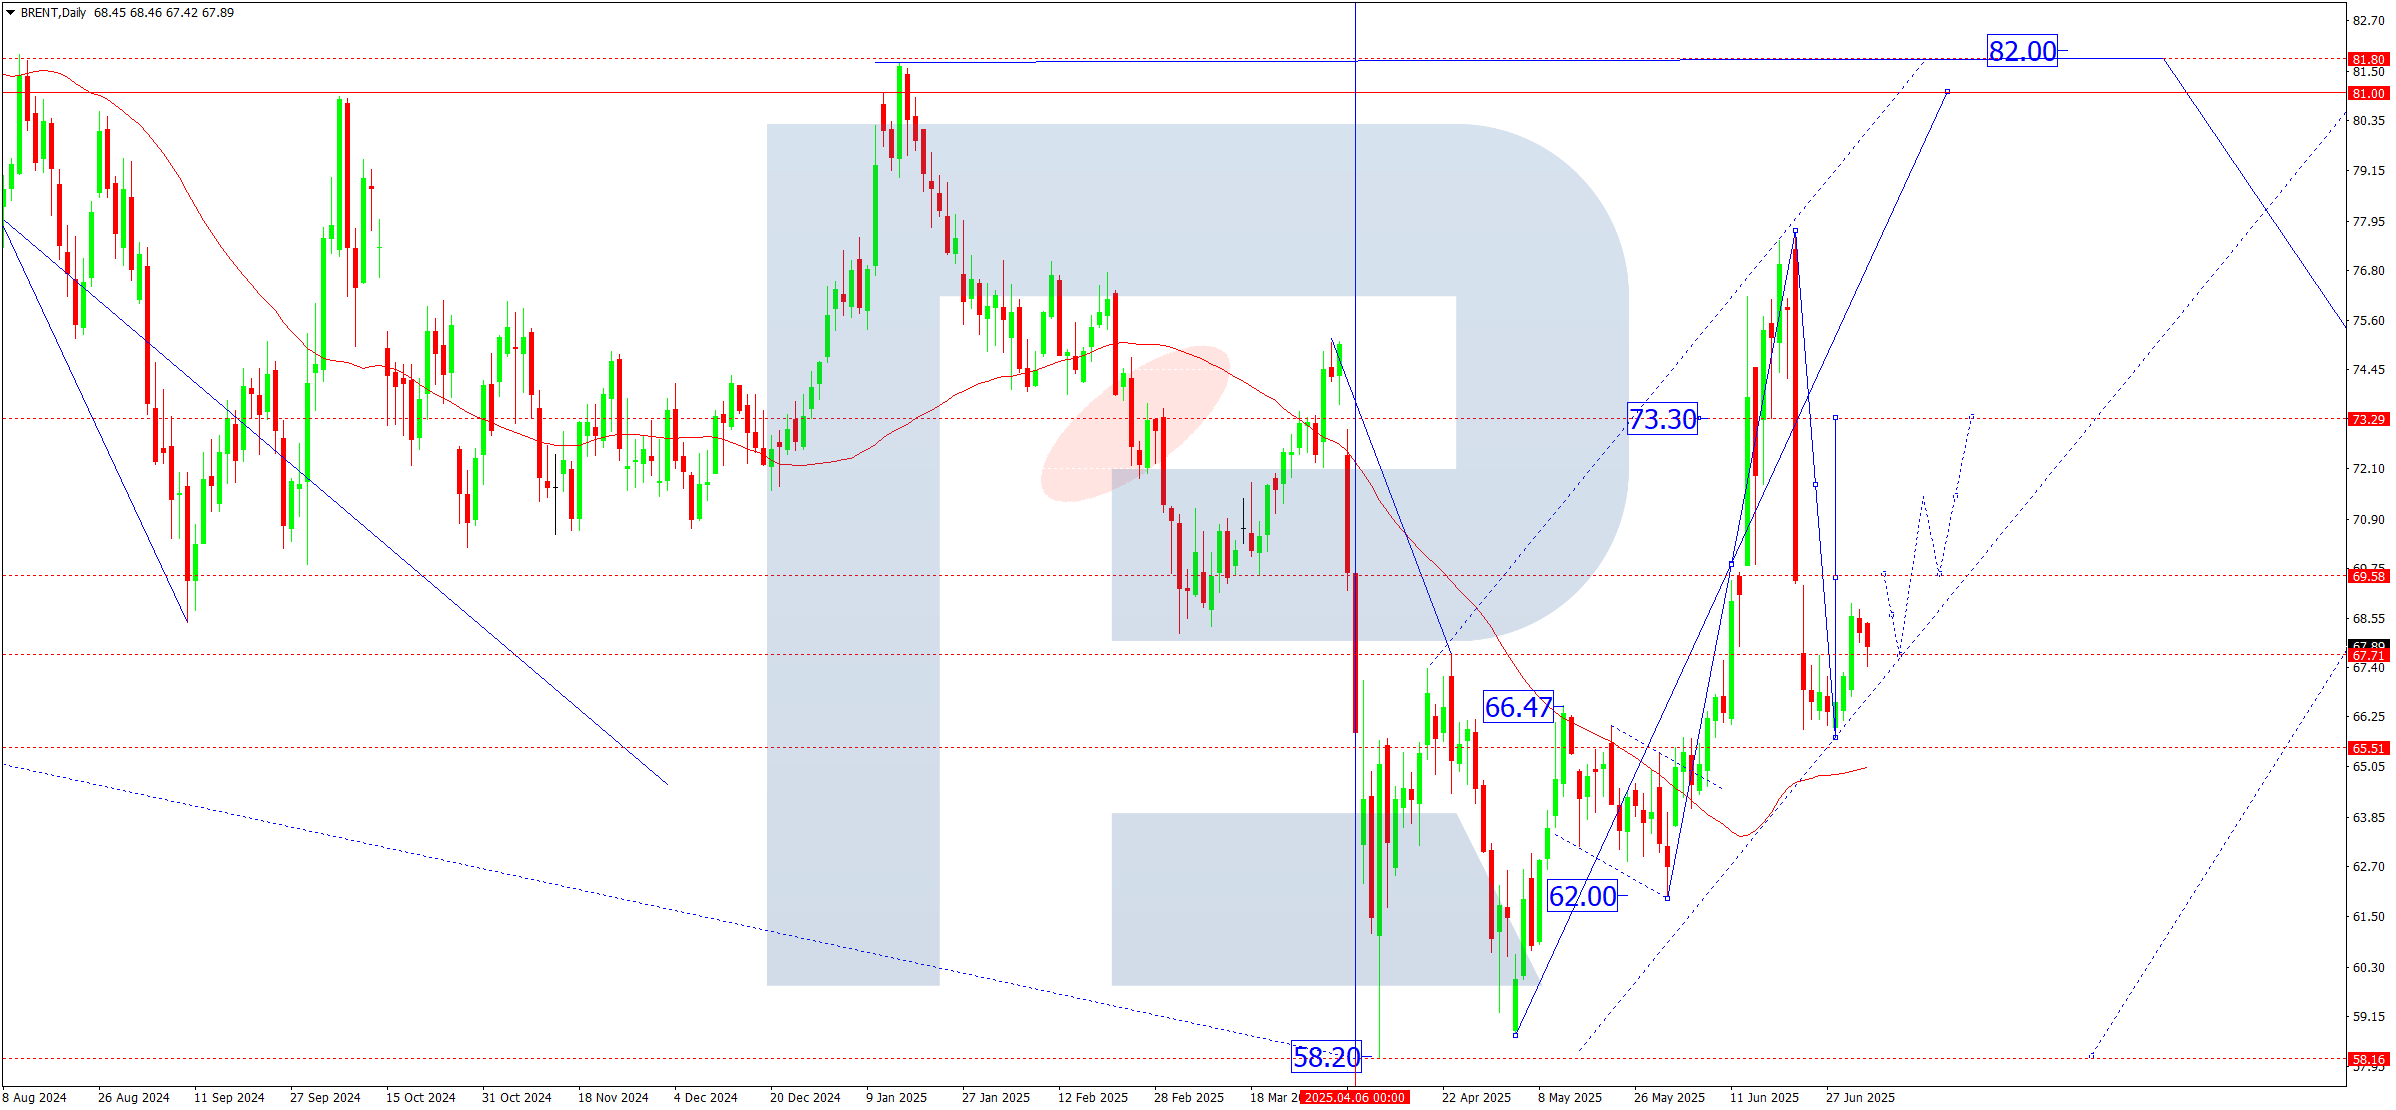
- Brent: Support: 70.00–74.00. Resistance: 72.72–82.00
EURUSD forecast
Weekly overview (7–11 July):
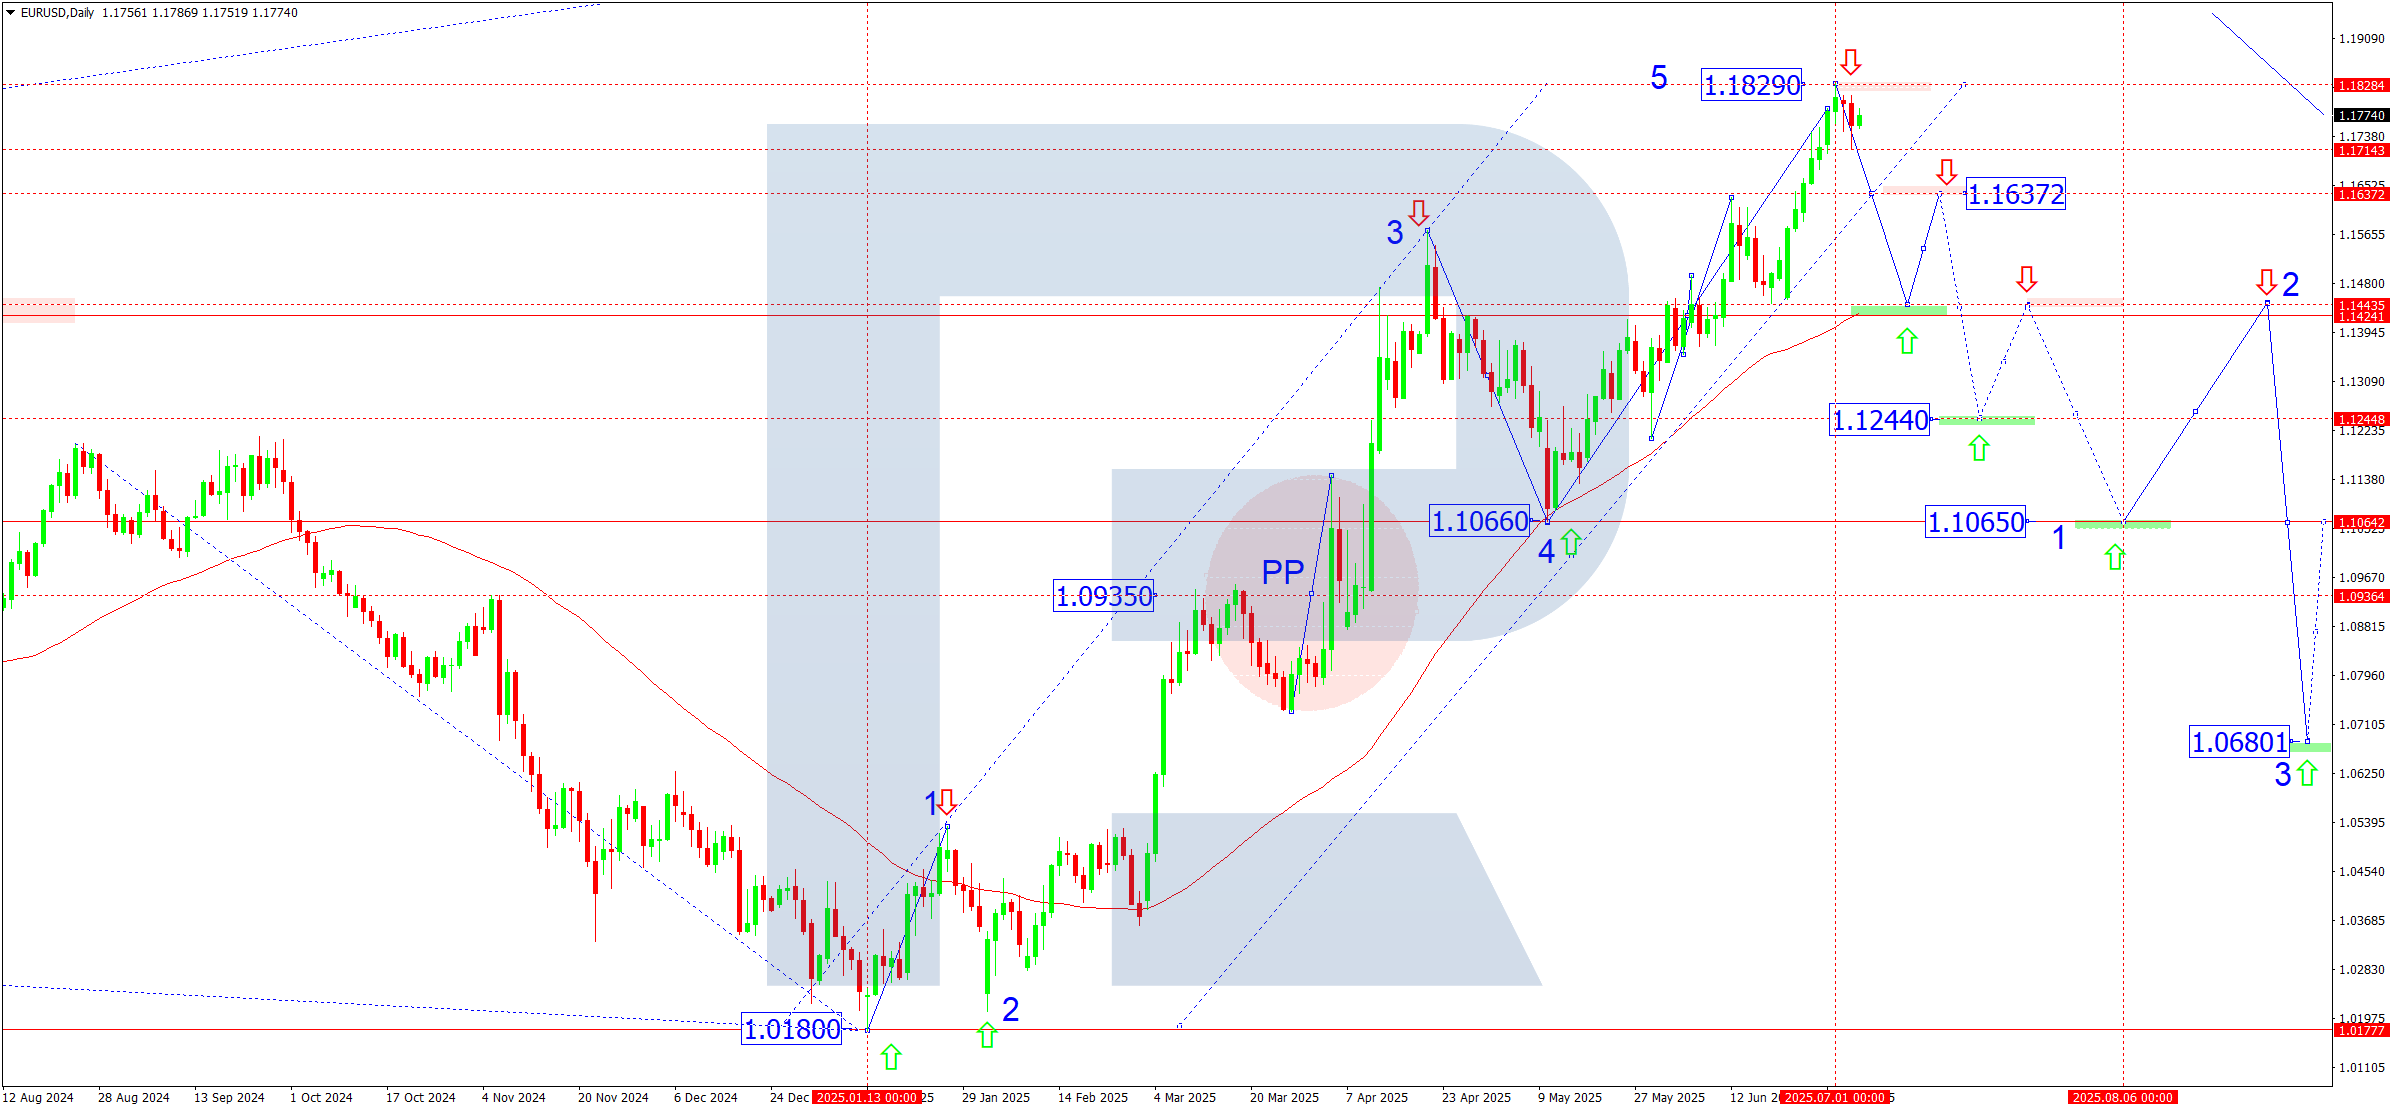
Last week EURUSD hit a yearly high at 1.1829, completing the fifth wave of growth from Pivot Point 1.0935. However, gains proved limited, and the market pulled back, hinting at a possible end to the current bullish phase.
Fundamentals:
The US passed a budget increasing national debt by USD 5 trillion. Initially, markets saw this as inflationary and bearish for the dollar, but under current conditions it is interpreted as a stimulus step that could spark a new investment cycle, reduce recession risks and support the dollar as a safe haven.
In the eurozone, macro data remain weak. Manufacturing remains under pressure and consumer activity slows. Stagflation and fiscal tensions in peripheral EU countries could weigh further on the euro, creating conditions for a EURUSD correction in coming weeks.
Technical analysis:
The daily chart shows a completed Elliott five-wave growth structure from 1.0180. The fifth wave peaked at 1.1829, after which the market started correcting. The current downward move reached 1.1714, then rebounded to 1.1787, possibly completing a correction wave.
If the price breaks 1.1637 (lower channel boundary), potential opens for a downside correction wave targeting:
First target: 1.1444 (SMA50 and support zone)
Then: 1.1240 and 1.1065, previous support levels
If pressure intensifies and the price consolidates below 1.1065, a deeper drop towards 1.0680 is possible, marking a potential third wave in a medium-term downward pattern.
Forecast scenarios:
- Bullish scenario: If EURUSD overcomes 1.1829 and closes above, growth could reach 1.1850, then extend to 1.1900–1.2000 if strong eurozone data or new dollar pressure emerges.
- Bearish scenario: A close below 1.1637 confirms a reversal structure, targeting 1.1444 (SMA50), then 1.1240 and 1.1065, depth depending on US macro data and ECB speeches.
USDJPY forecast
Weekly overview (7–11 July):
USDJPY remains in broad consolidation around 145.00, reacting to both domestic Japanese and global dollar dynamics. Japanese officials repeatedly warn of possible FX intervention if yen weakness persists above 145.00, which effectively cools USDJPY buying.
The dollar gains support from expectations that the Fed could start cutting rates towards late summer. Despite slowing inflation, the Fed remains cautious, stressing data dependence.
The Bank of Japan keeps ultra-loose policy but has signalled possible normalisation in coming quarters. Yet, US bond yields remain much higher, sustaining carry-trade flows and underlying USD demand against JPY.
Technical analysis:
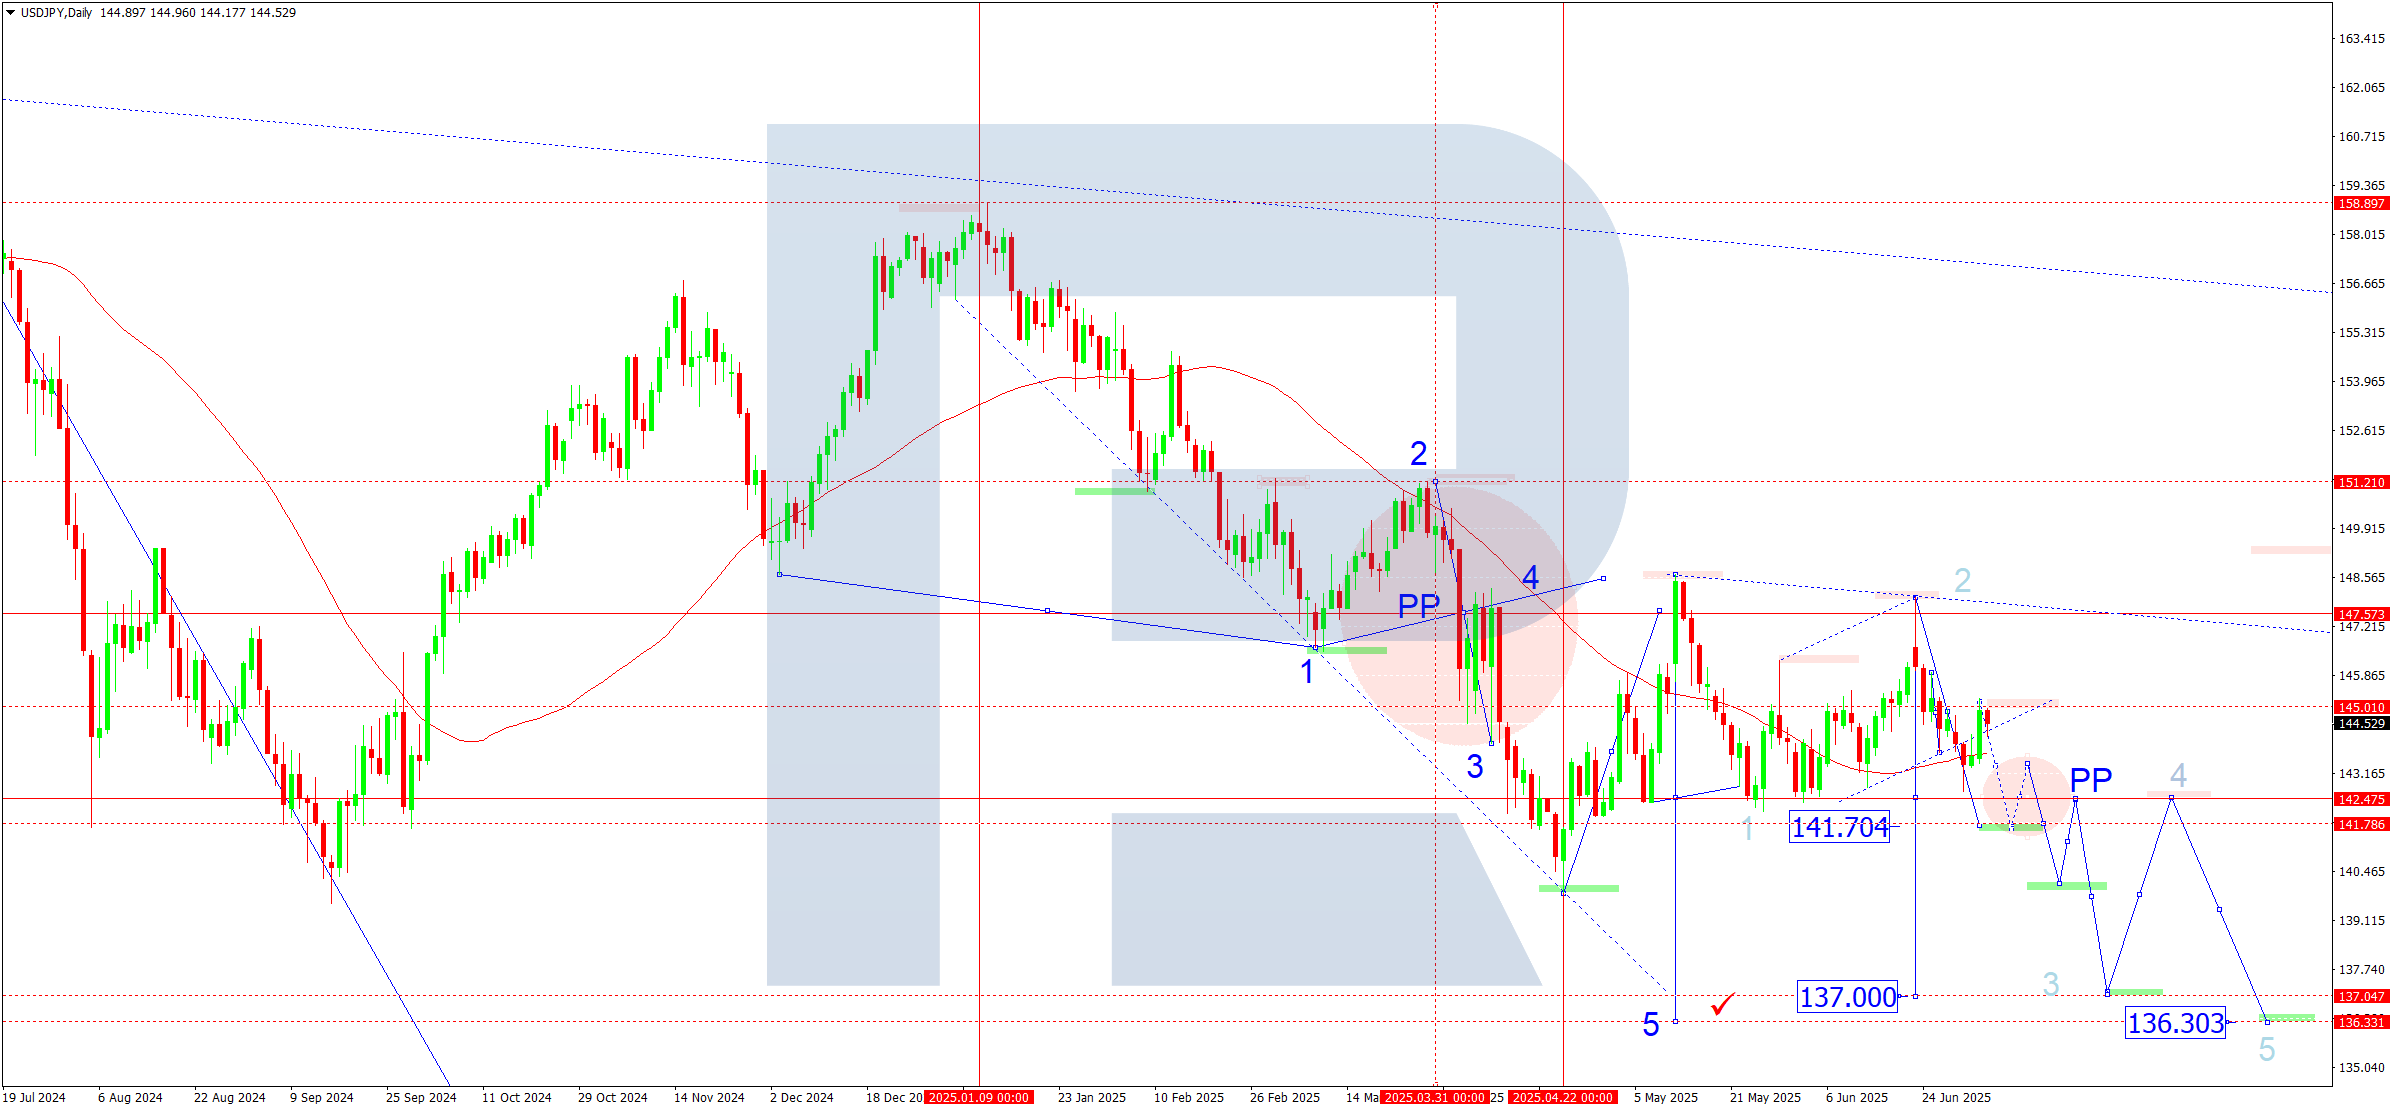
The daily chart retains a downward wave structure aiming for 141.70 – the intermediate fifth wave target. After reaching this, a short-term recovery to 142.42 (new Pivot Point) may follow.
SMA50 acts as dynamic resistance. A break below 141.70 strengthens prospects for further decline to 137.00 and then 136.30.
Forecast scenarios:
- Bullish scenario: A stable close above 146.00 activates an up-structure towards the triangle top at 147.50, possibly extending to 151.20 (March 2025 high) under strong momentum.
- Bearish scenario: A drop below 142.00 and a break of 141.70 confirms a downside triangle breakout, targeting 140.00, then 137.00 and 136.30.
GBPUSD forecast
Weekly overview (7–11 July):
GBPUSD maintains a moderately bullish trend, hitting a current wave high of 1.3780, its highest since September 2022. Sterling is supported by Bank of England policy, which remains more restrained compared to the ECB despite economic slowdown signs.
UK inflation stays above target (3.4% in May), limiting rapid policy easing. However, with GDP contracting and weaker consumer and labour data, markets expect an August BoE rate cut from 4.25% to 4.00%. Governor Andrew Bailey notes inflation stems mainly from regulated tariffs, not overheating.
Internal political tension around social reforms also affects GBP volatility.
Technical analysis:
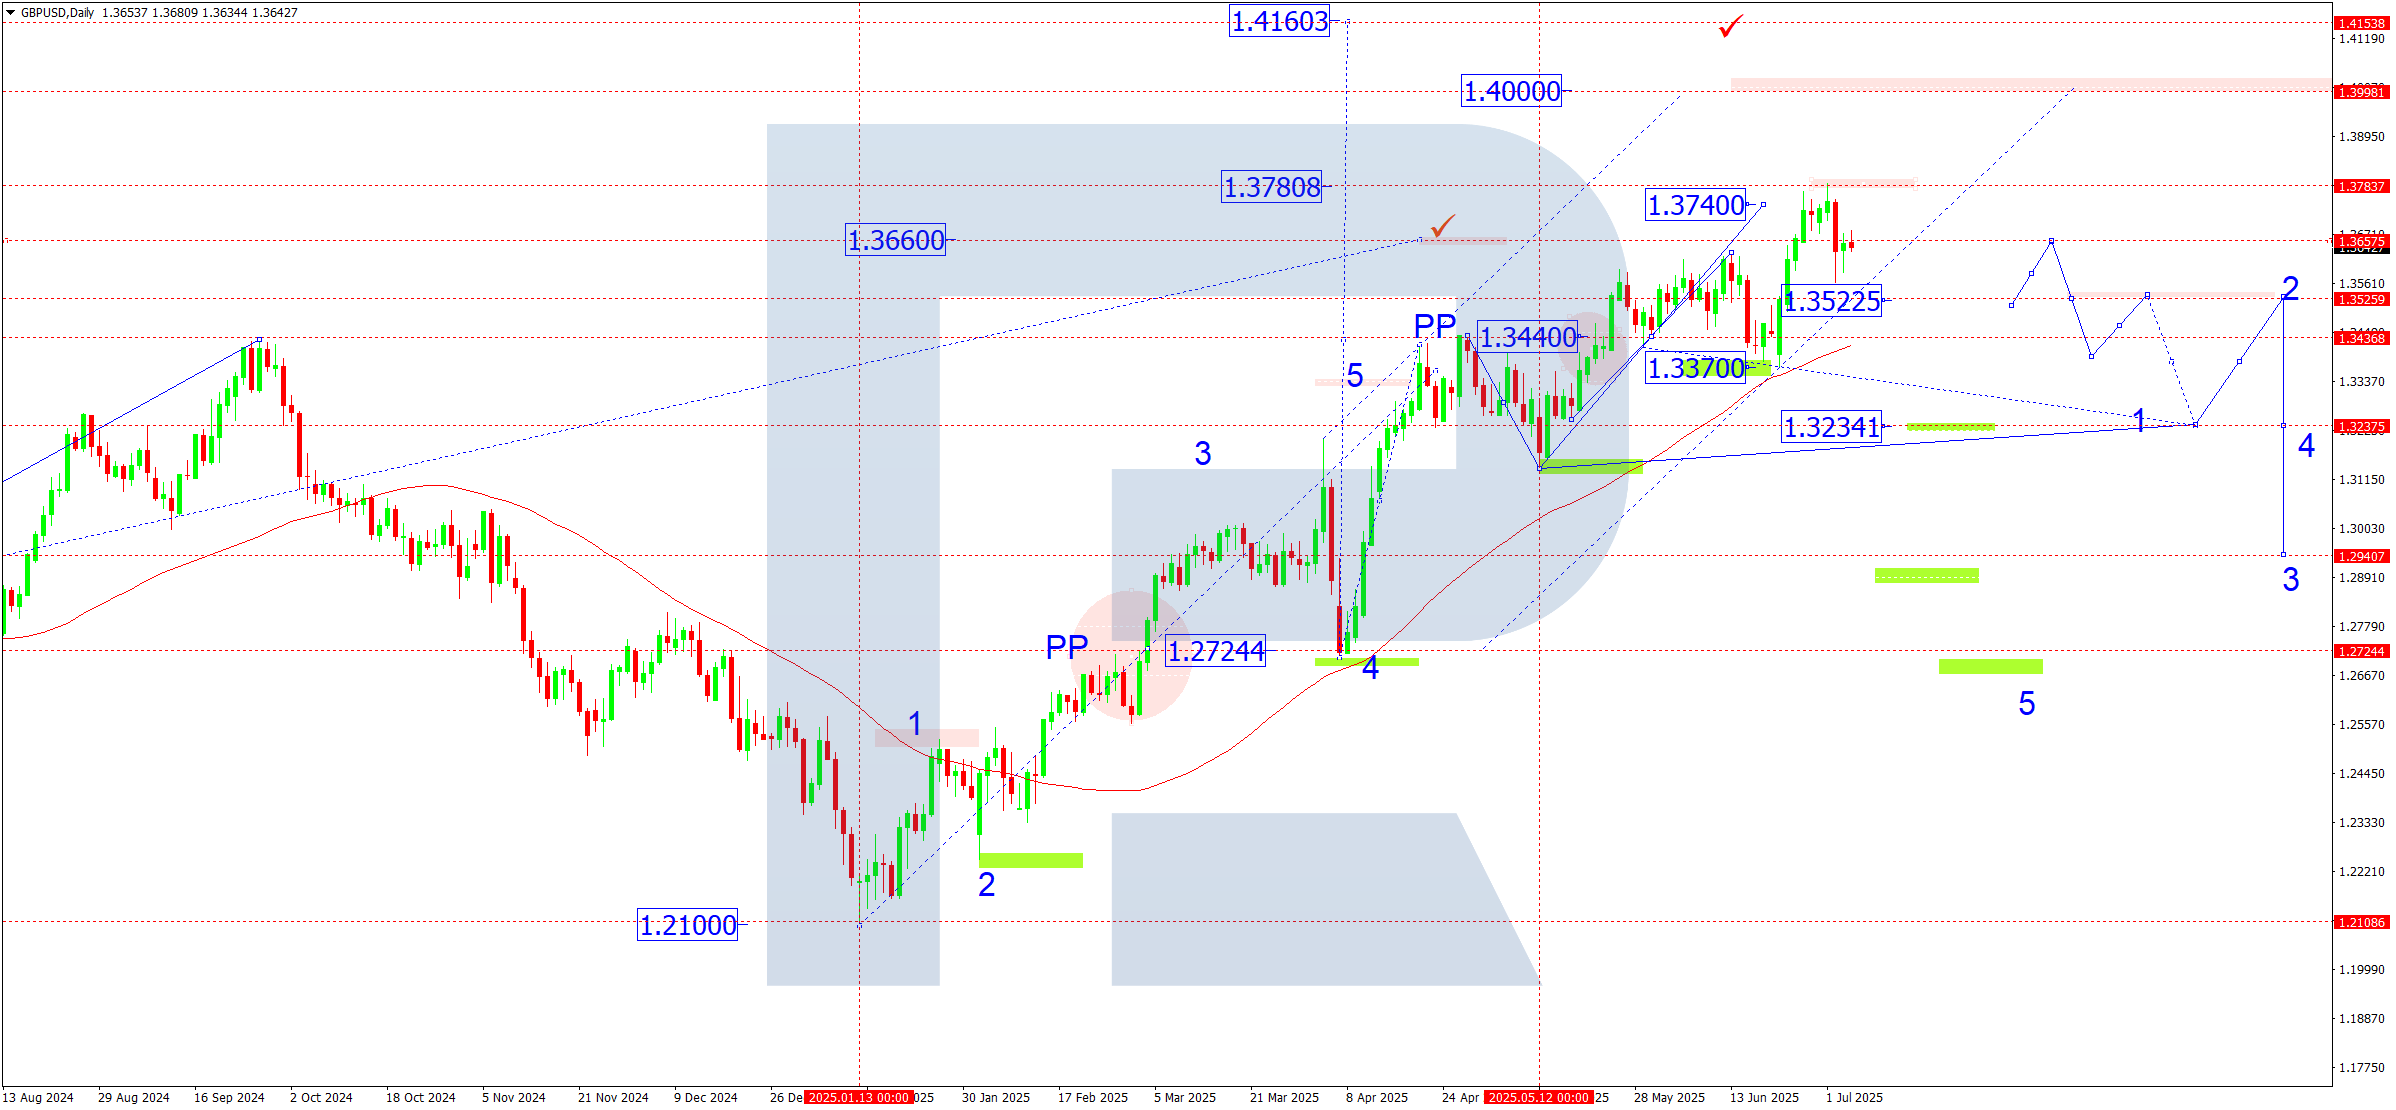
On the daily chart the pair completed its fifth growth wave, with Pivot Point shifting to 1.3440, a key balance area.
Short-term moves target 1.3522, then possibly rebound to 1.3660. A break below 1.3440 increases downside risk to 1.3234, then 1.2940 (50% retracement).
Holding above SMA50 and a break of 1.3660 favour growth to 1.3800 and, under strong momentum, the psychological 1.4000 level, a historical reversal zone.
Forecast scenarios:
- Bearish scenario: A break below 1.3440 targets 1.3234, then 1.2940, and under extended correction, 1.2724.
- Bullish scenario: Staying above SMA50 and breaking 1.3660 extends the uptrend to 1.3800, then 1.4000, with a possible test of 1.4160 under high volatility.
AUDUSD forecast
Weekly overview (7–11 July):
Australia’s economy faces growing external pressure amid global trade flow shifts. Macroeconomic data worsened for a third month, including falling retail sales and slowing services and industrial sectors.
Key instability drivers remain trade and tariff disputes, especially US policies against China, which hamper Australia’s raw material exports (coal, gas, iron ore). China’s economic weakness, as its main buyer, heavily pressures growth prospects.
The Reserve Bank of Australia maintains caution in monetary policy while inflation shows stabilising signs. Amid globally tighter financial conditions, AUD stays sensitive to risk-asset demand swings.
Technical analysis:
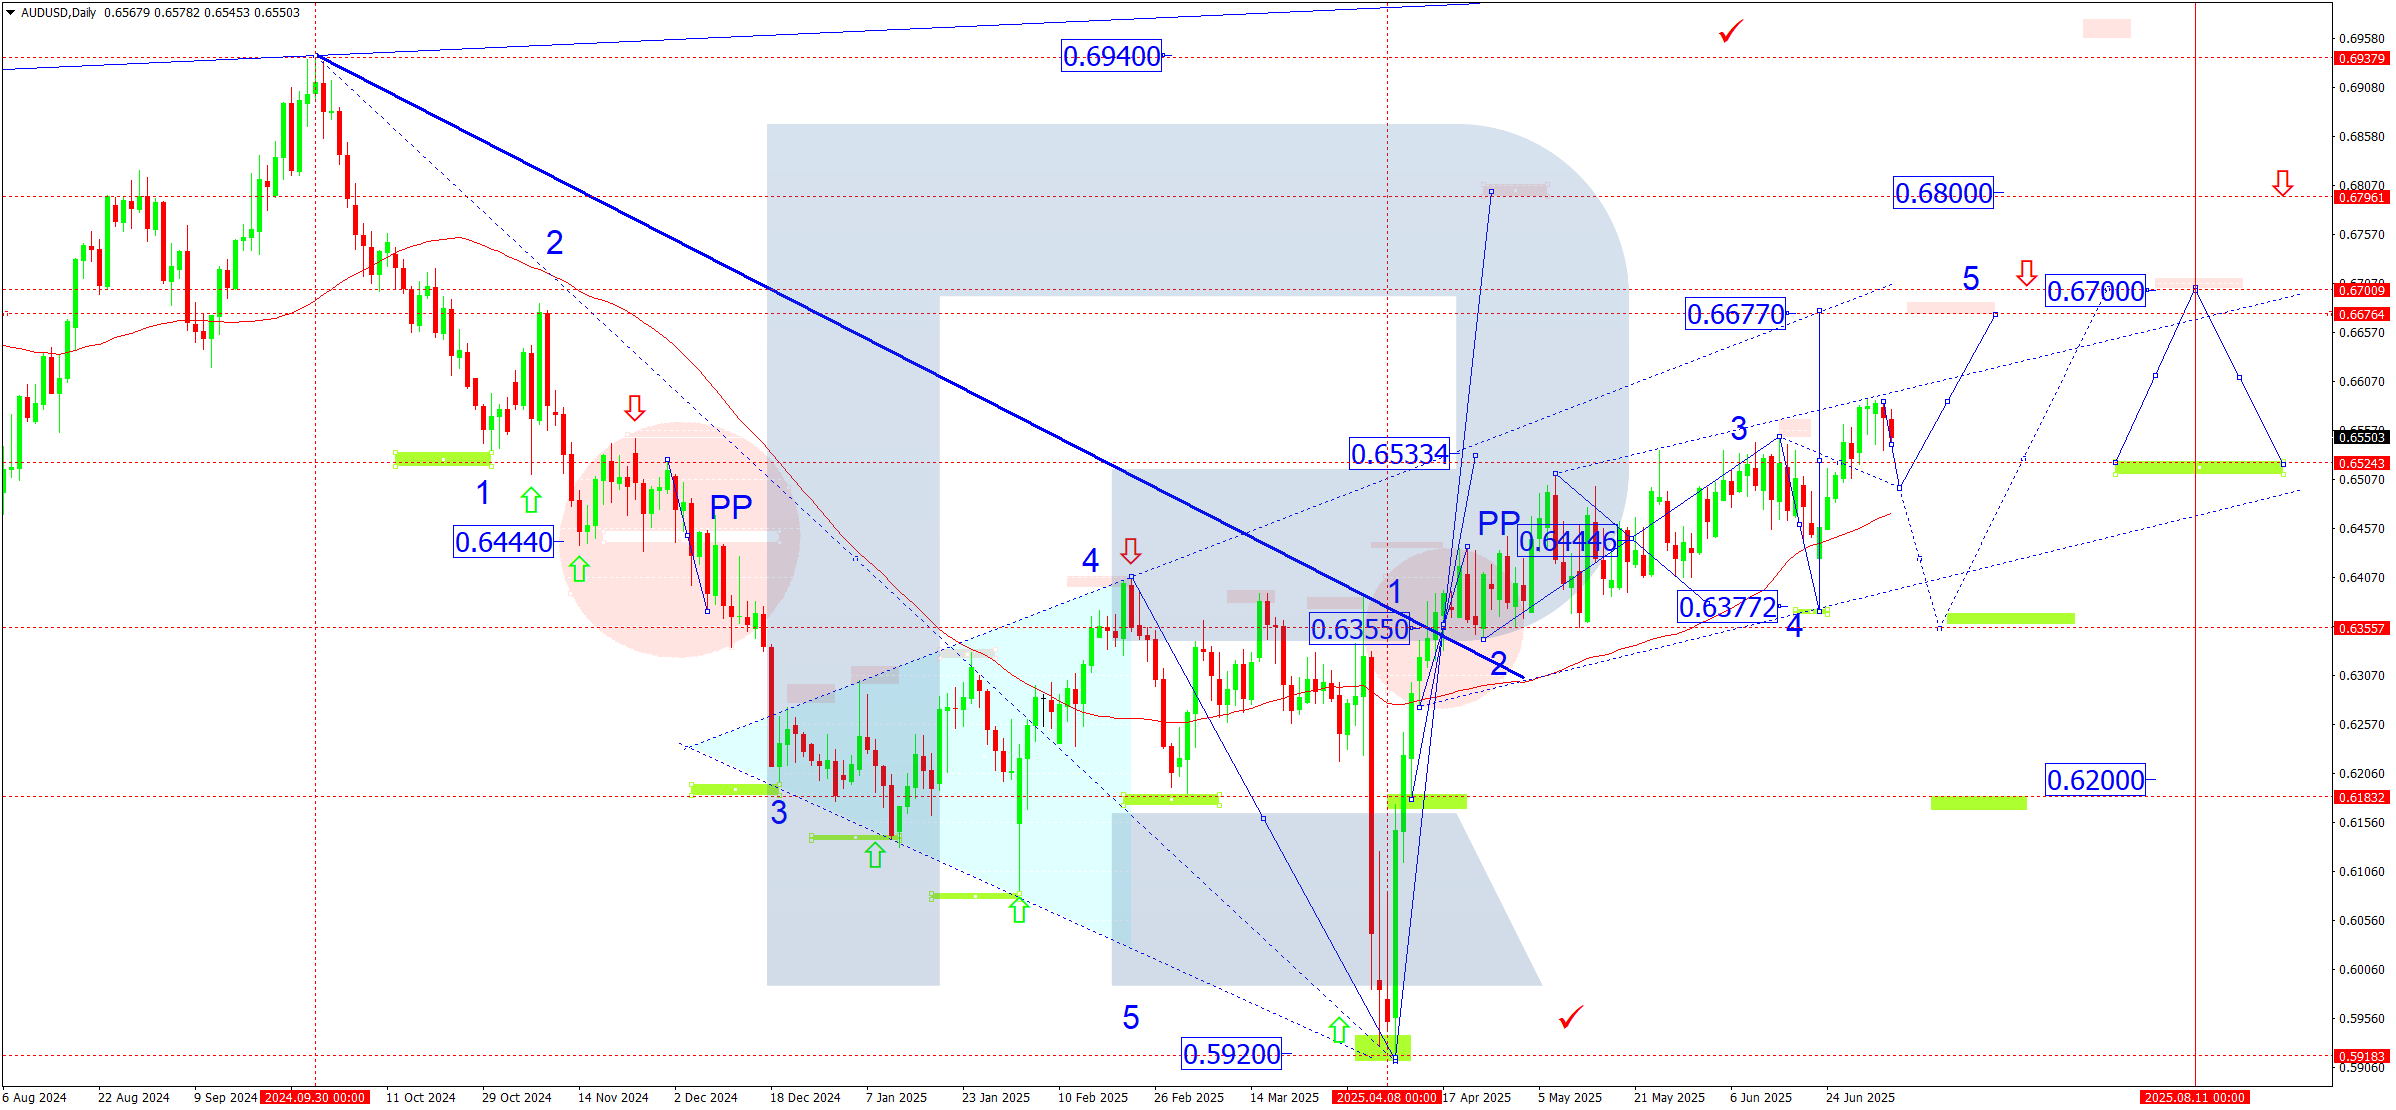
The daily chart shows AUDUSD breaking out of consolidation by surpassing key resistance at 0.6533, confirming an upside exit from the sideways range. This opens potential growth towards 0.6677 and, under favourable momentum, to 0.6700.
This week’s Pivot Point remains around 0.6533, reinforcing its importance as a support area in short-term corrections. SMA50 also supports continuation of the current bullish impulse.
If buyers maintain control above 0.6550, a stretched fifth wave could extend towards 0.6800, possibly coinciding with seasonal demand for commodity currencies and stabilisation in China later in July.
Forecast scenarios:
- Bearish scenario: A break of 0.6440 signals an exit from the ascending channel, leading to a test of 0.6377 and the key support zone at 0.6355 (PP). A further drop opens the path to 0.6200, revisiting March’s long-term low.
- Bullish scenario: Holding above 0.6533 and breaking 0.6550 confirms continued upside. Targets are 0.6677 and 0.6700, with potential for 0.6800 if momentum strengthens. A new growth phase may follow short-term corrections, supported by equity market stabilisation and raw material demand.
USDCAD forecast
Weekly overview (7–11 July):
USDCAD remains pressured, continuing its downtrend since February 2025. Key factors include escalating US-Canada political rhetoric and deepening trade tensions. The “51st state” concept remains declarative but reflects mounting US economic and tariff pressure.
Markets also expect the Bank of Canada to cut rates while the Fed maintains high rates for longer. This divergence creates upward potential for the pair, though short-term trends stay bearish.
Oil price declines, Canada’s key export, add further CAD weakening risks if technical supports near 1.3500 fail.
Technical analysis:
The daily chart shows USDCAD in the third wave of its downtrend from February’s peak. After rejecting resistance at 1.4020 and briefly testing 1.3798, the market re-entered the descending channel.
Current movement forms the second phase of the third wave targeting 1.3500, a key support and psychological marker. The 50-day SMA continues to pressure from above.
The scenario suggests further decline to 1.3470, possibly consolidating before a corrective fourth wave rebound towards 1.4000.
Forecast scenarios:
- Bullish scenario: A breakout above 1.3750 and close above the 50-day SMA signals the end of the down wave, opening growth first to 1.3800, then towards 1.4000, retesting the trend wave’s PP.
- Bearish scenario: Staying below 1.3750 and breaking 1.3600 increases pressure. A break of 1.3500 confirms a bearish model targeting 1.3470, and under acceleration, 1.3250.
XAUUSD forecast
Weekly overview (7–11 July):
Gold continues a wide consolidation near the key 3,300 level, maintaining its long-term uptrend from November 2024. Fundamental support remains strong, driven by geopolitical tensions, central bank purchases and global monetary policy uncertainty.
Asia, Middle East and Eastern Europe tensions strengthen gold’s safe-haven appeal. Disrupted logistics chains and US tariff barriers push markets towards real-asset backed contracts over dollar settlements. Since early 2025, central banks purchased over 250 tonnes of gold, showing a clear dedollarisation trend. Major buyers include China, Turkey, India, Egypt, Saudi Arabia and Kazakhstan. Large funds also raised gold allocation to 5–7 % in strategic portfolios amid declining trust in reserve currencies and banking system vulnerabilities.
Technical analysis:
Gold’s uptrend remains intact. Price reached a local peak at 3,499 before correcting to 3,120 (38 % Fibonacci retracement).
Last week it rose to 3,450 but failed to hold above, entering consolidation below this resistance. The short-term ascending channel break combined with an SMA50 support test suggests correction deepening is possible.
A break below 3,250–3,200 opens potential for a fall to 3,000–2,950, April’s key levels. After stabilisation here, a new upward impulse towards 3,550–4,000 may begin.
Forecast scenarios:
- Bullish scenario:
Holding above 3,350 and breaking 3,450 strengthens the uptrend, targeting:
3,500 – psychological and May resistance
3,600 – wave expansion target
4,000 – potential new wave objective if geopolitical risks rise and Fed policy eases
- Bearish scenario: A break below 3,250 then 3,120 opens a path to 3,000. If correction deepens further, gold may test 2,950–2,900 before starting a new long-term growth wave.
Brent forecast
Weekly overview (7–11 July):
Brent began a recovery cycle last week, climbing above 67.00 after several declining weeks. However, the rebound remains fragile amid conflicting market signals.
On 6 July, OPEC+ discussed potential output increases. Some countries showed readiness to raise quotas by 411,000 bpd from August if market conditions improve, capping aggressive price gains despite geopolitical risks.
US commercial crude stocks rose by 3.845 million barrels, against expectations of a 2 million drop, signalling oversupply.
Meanwhile, US employment growth hints at recovering domestic demand, especially in transport and industrial sectors.
Such mixed signals increase uncertainty around Fed policy. Strong labour data delays rate cuts, but rising inventories and slowing inflation could prompt easing by September.
Technical analysis:
The daily chart shows Brent ending its correction and starting a new growth wave.
The market broke above 67.70, signalling renewed buying and a fifth wave rise.
First target: 73.30, a former strong resistance zone.
If price consolidates above, potential opens for 77.00 and then 81.00, the local high and key fifth wave objective.
SMA50 acts as dynamic support, indicating an ongoing bullish phase.
Forecast scenarios:
- Bullish scenario:
A break and hold above 67.70 confirms a new growth phase. This week’s targets:
73.30 – first fifth wave target
77.00 – medium-term resistance
81.00 – local objective
- Bearish scenario:
A break below 65.50, especially under 64.00, returns the market to seller pressure. Targets:
62.00 – nearest support
58.00 – lower boundary of the March–April consolidation range.
