World indices overview: news from US 30, US 500, US Tech, JP 225, and DE 40 for 18 February 2025
While there are weak uptrends in global stock indices, they may end in sweeping corrections. Find out more in our analysis and forecast for global indices for 18 February 2025.
US indices forecast: US 30, US 500, US Tech
- Recent data: US industrial production rose by 0.5% in January
- Market impact: a stronger-than-expected increase (0.5% vs the expected 0.3%) may support investor sentiment, especially in sectors sensitive to economic growth
Fundamental analysis
In the short term, the better-than-expected industrial production reading may bolster the stock market, particularly in cyclical sectors. However, a slowdown in growth compared to the previous period may fuel concerns about the sustainability of the economic recovery, potentially leading to volatility in the stock market.
According to Bank of America, the US stock market has never been more fragile. In this case, it can be seen in daily price movements of the company’s stock amid increased volatility. The figure reached the highest level ever among 50 largest stocks in the S&P 500 index. The market is more vulnerable now than it was during the dot-com bubble.
US 30 technical analysis
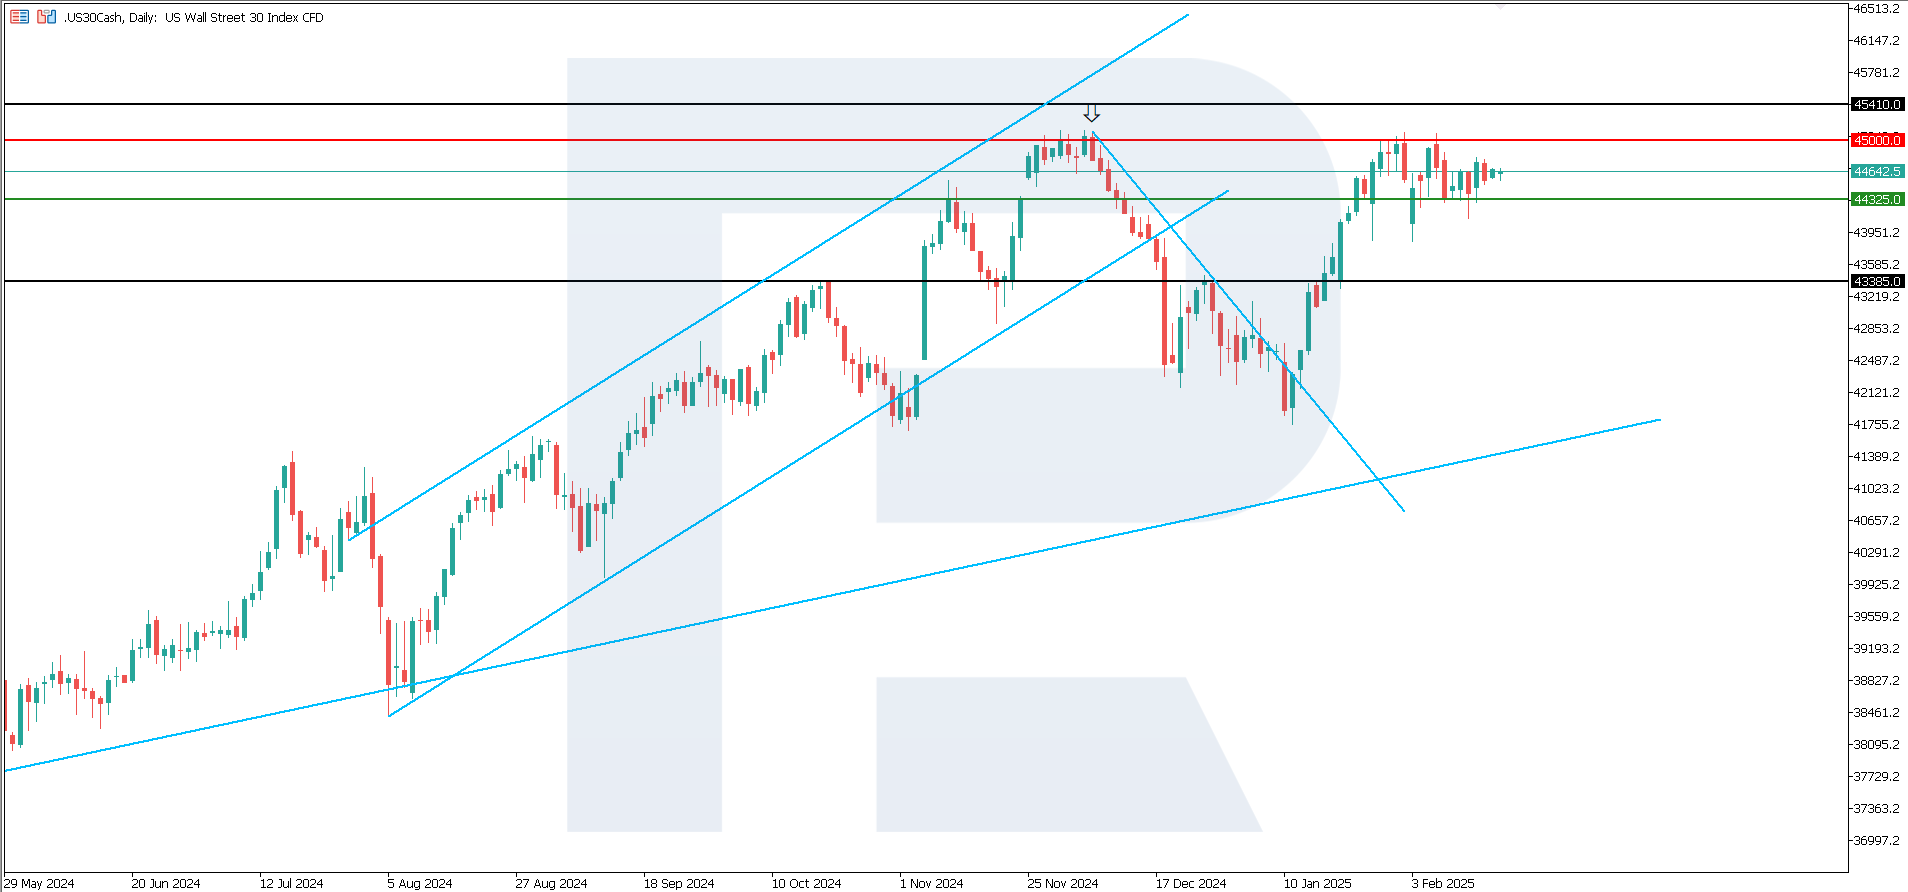
The US 30 stock index continues to trade in a sideways channel. There is still potential for a breakout above its upper boundary at 45,000.0. However, it is unlikely to happen in the short term.
The following scenarios are considered for the US 30 price forecast:
- Pessimistic US 30 forecast: a breakout below the 44,325.0 support level could push the index down to 43,385.0
- Optimistic US 30 forecast: a breakout above the 45,000.0 resistance level could drive the index to 45,410.0
US 500 technical analysis
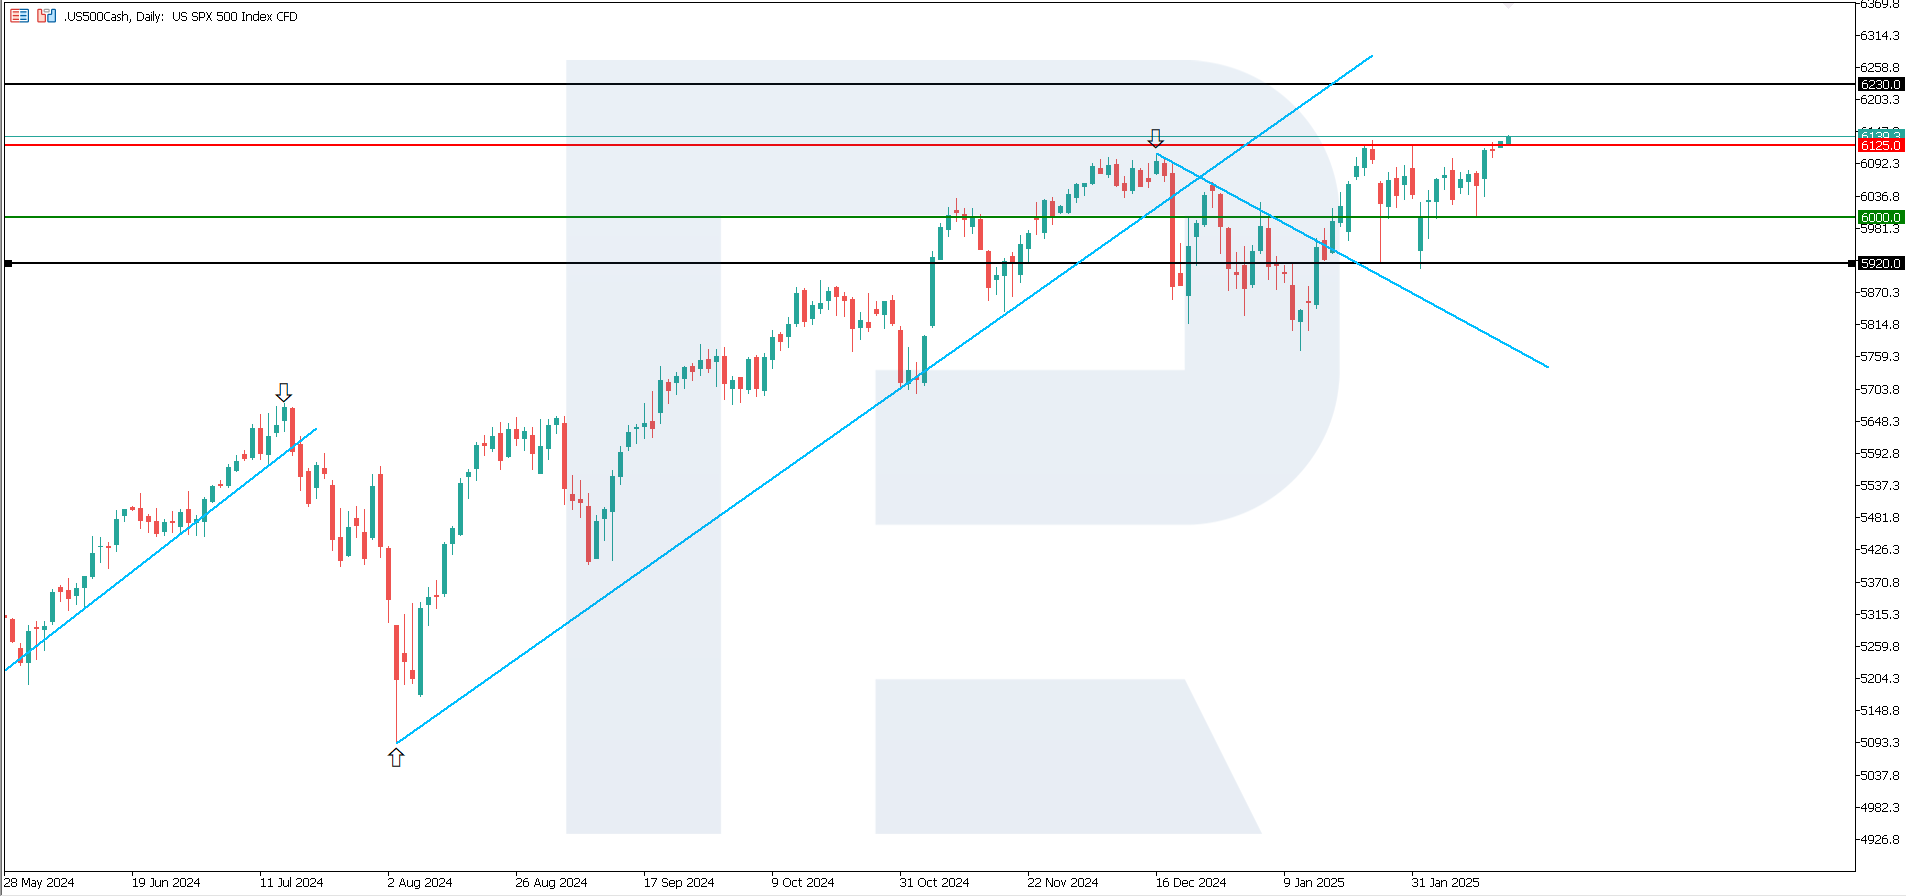
The US 500 stock index broke the 6,125.0 resistance level. However, according to the US 500 technical analysis, the momentum was rather weak, suggesting that this breakout could be false.
The following scenarios are considered for the US 500 price forecast:
- Pessimistic US 500 forecast: a breakout below the 6,000.0 support level could send the index down to 5,920.0
- Optimistic US 500 forecast: if the price consolidates above the previously breached resistance level at 6,125.0, it could rise to 6,230.0
US Tech technical analysis
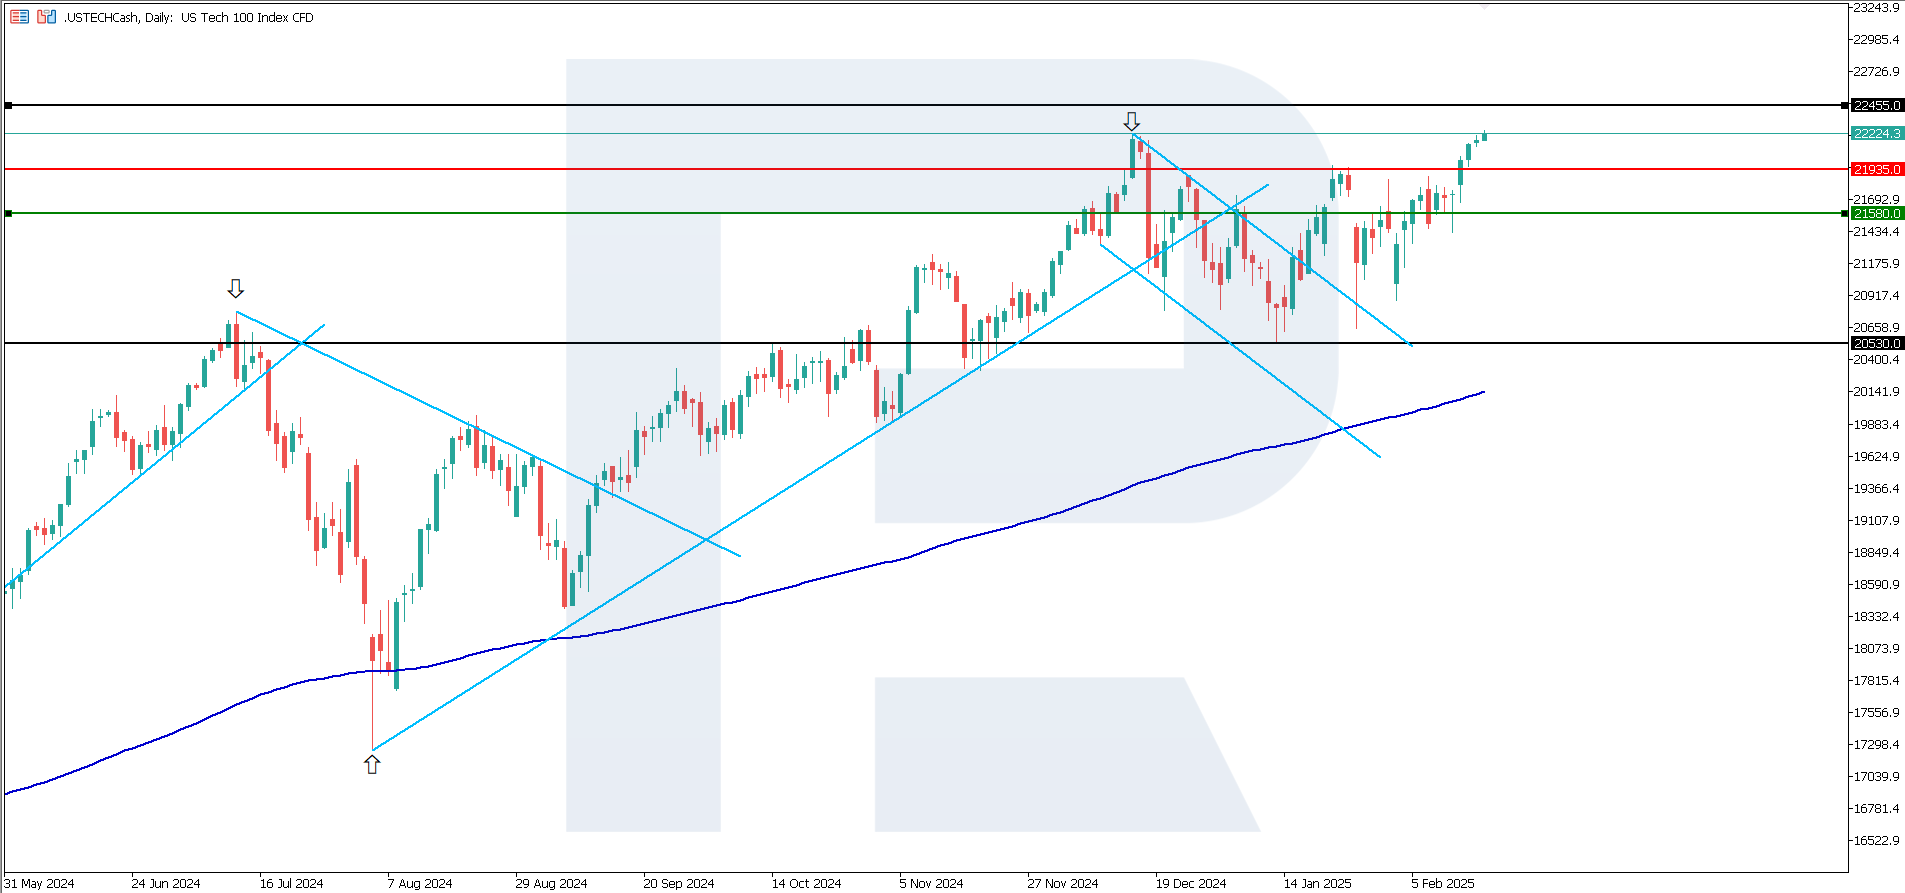
The US Tech stock index is trading near an all-time high and has surpassed the 21,935.0 resistance level. However, the US Tech technical analysis shows that the growth momentum is weakening. In the short term, a correction is most likely, potentially triggering a downtrend.
The following scenarios are considered for the US Tech price forecast:
- Pessimistic US Tech forecast: a breakout below the 21,580.0 support level could send the index down to 20,530.0
- Optimistic US Tech forecast: if the price consolidates above the previously breached resistance level at 21,935.0, it could climb to 22,455.0
Asian index forecast: JP 225
- Recent data: Japan’s GDP grew by 2.8% in 2024
- Market impact: a strong uptick in GDP indicates a healthy economy, which boosts investor confidence
Fundamental analysis
Economic growth was 2.8% year-on-year, also well above the forecast of 1.0% and the previous 1.7%. This indicates that Japan’s economic development is significantly ahead of analysts’ expectations.
Stronger-than-expected GDP growth in Q4 2024 is a favourable signal for the Japanese economy. This could drive up stocks as improving economic activity positively affects corporate earnings and strengthens investor confidence in the Japanese market.
JP 225 technical analysis
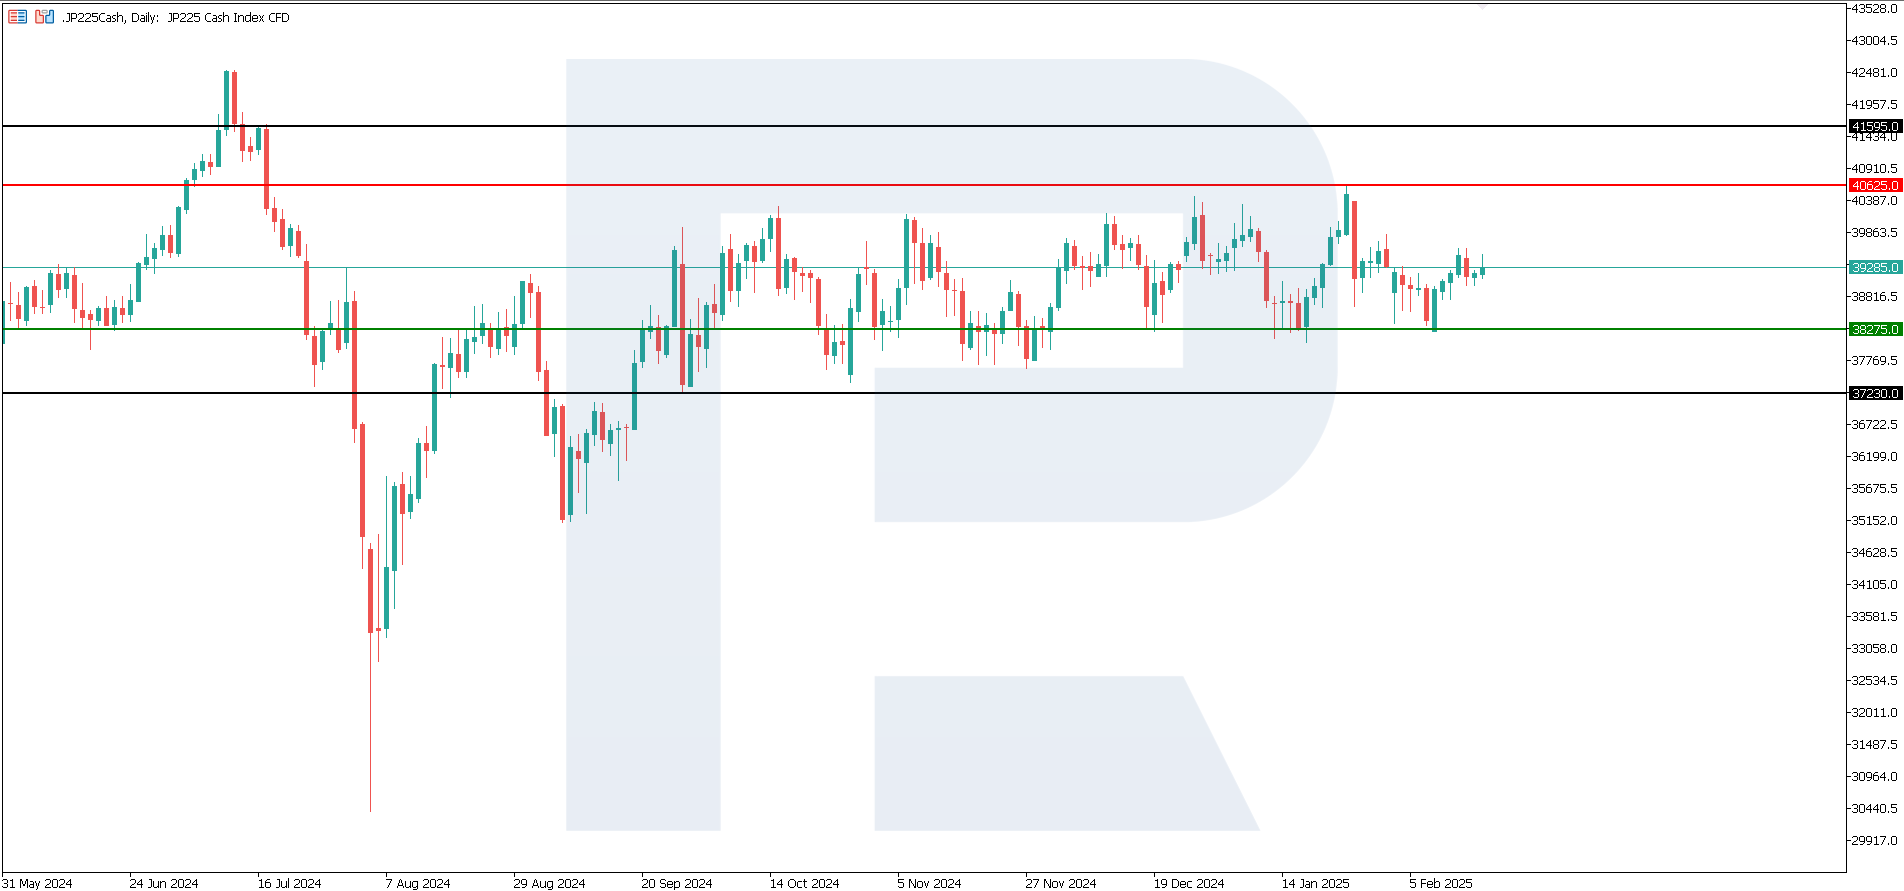
The JP 225 stock index has rebounded from the lower boundary of the sideways channel at 38,275.0 and is heading towards the 40,625.0 resistance level. According to the JP 225 technical analysis, a breakout above this level is unlikely in the short term. This sideways trend can be classified as medium-term.
The following scenarios are considered for the JP 225 price forecast:
- Pessimistic JP 225 forecast: a breakout below the 38,275.0 support level could push the index down to 37,230.0
- Optimistic JP 225 forecast: a breakout above the 40,625.0 resistance level could propel the index to 41,595.0
European index forecast: DE 40
- Recent data: Germany’s services PMI was 52.5 in January
- Market impact: this is a positive signal for the economy as the services sector accounts for a significant share of GDP
Fundamental analysis
The increase in the services PMI indicates sustainable or even accelerating growth in business activity in the services sector, potentially boosting optimism among investors and supporting stocks of companies operating in the industry. These statistics could bolster companies listed on the stock market and involved in the services sector (financial institutions, IT companies, transport, logistics, tourism, etc.).
At the same time, the issue of US trade tariffs has not yet been settled. According to Germany’s central bank chief, the US tariff policy will seriously hurt the German economy. Since the country is export-oriented, its economy will suffer great losses due to changes in the US policy.
DE 40 technical analysis
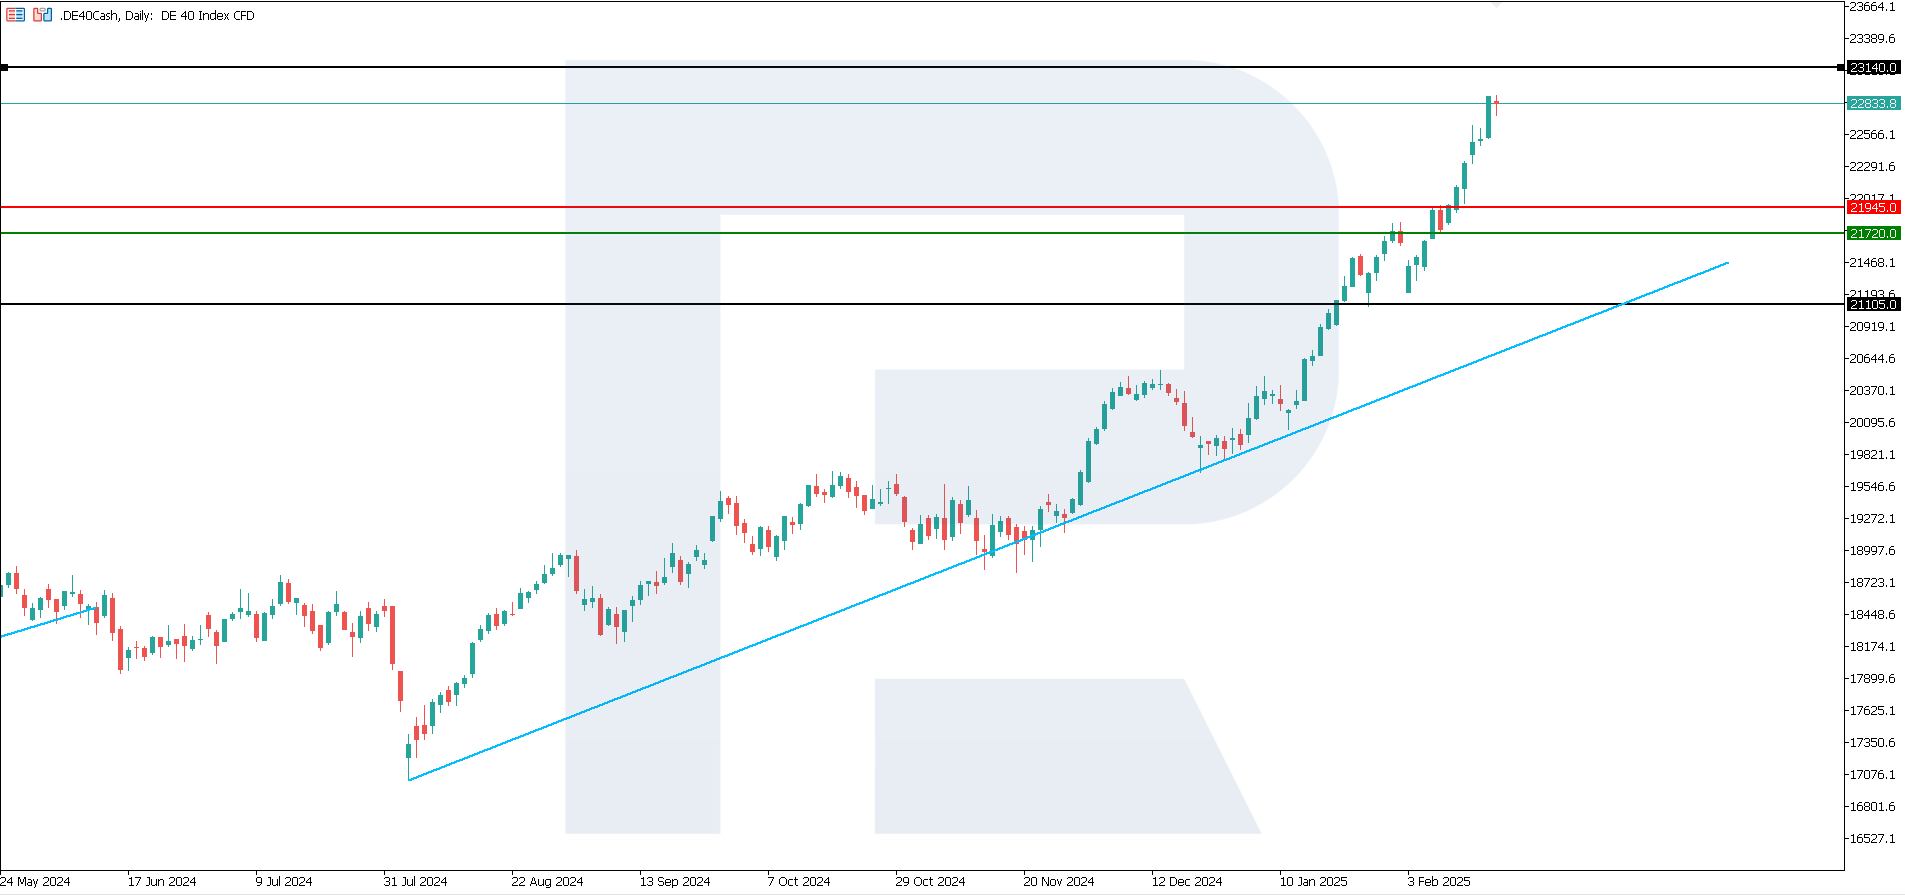
The uptrend in the DE 40 index continues. The previously expected correction did not occur. As the DE 40 technical analysis shows, the uptrend is medium-term. There are no prerequisites for its change in the short run.
The following scenarios are considered for the DE 40 price forecast:
- Pessimistic DE 40 forecast: a breakout below the 21,720.0 support level could send the index down to 21,105.0
- Optimistic DE 40 forecast: if the price consolidates above the previously breached resistance level at 21,945.0, it could climb to 23,140.0
Summary
US stock indices, except for the US 30, headed towards all-time highs. However, the growth momentum was rather weak, which does not give grounds to expect a sustainable uptrend. Japan’s positive GDP data for 2024 did not allow the JP 225 stock index to break out of the sideways channel. The DE 40 index continues to grow steadily to new all-time highs.
