World indices overview: news from US 30, US 500, US Tech, JP 225, and DE 40 for 20 February 2025
Most global indices started to correct, with only the US 500 index showing slight growth. Find out more in our analysis and forecast for global indices for 20 February 2025.
US indices forecast: US 30, US 500, US Tech
- Recent data: at the last meeting, the FOMC decided to suspend the key rate-cutting cycle
- Market impact: the absence of further tightening (new rate hikes) and tough comments on rate reduction may support the stock market
Fundamental analysis
The regulator is trying to act as carefully as possible and does not rush to further ease monetary policy. The stock market usually prefers softer conditions as low rates make financing more accessible to businesses. However, in this case, the lack of aggressive easing is not necessarily bad news since the US economy continues to show fairly sustainable growth.
Current trade tariffs (and the threat of new ones) may increase the cost of imported goods, driving up prices and supporting inflation risks. However, despite the negative consequences of such measures for the economy, investors remain optimistic, with the US 500 index reaching an all-time high.
US 30 technical analysis
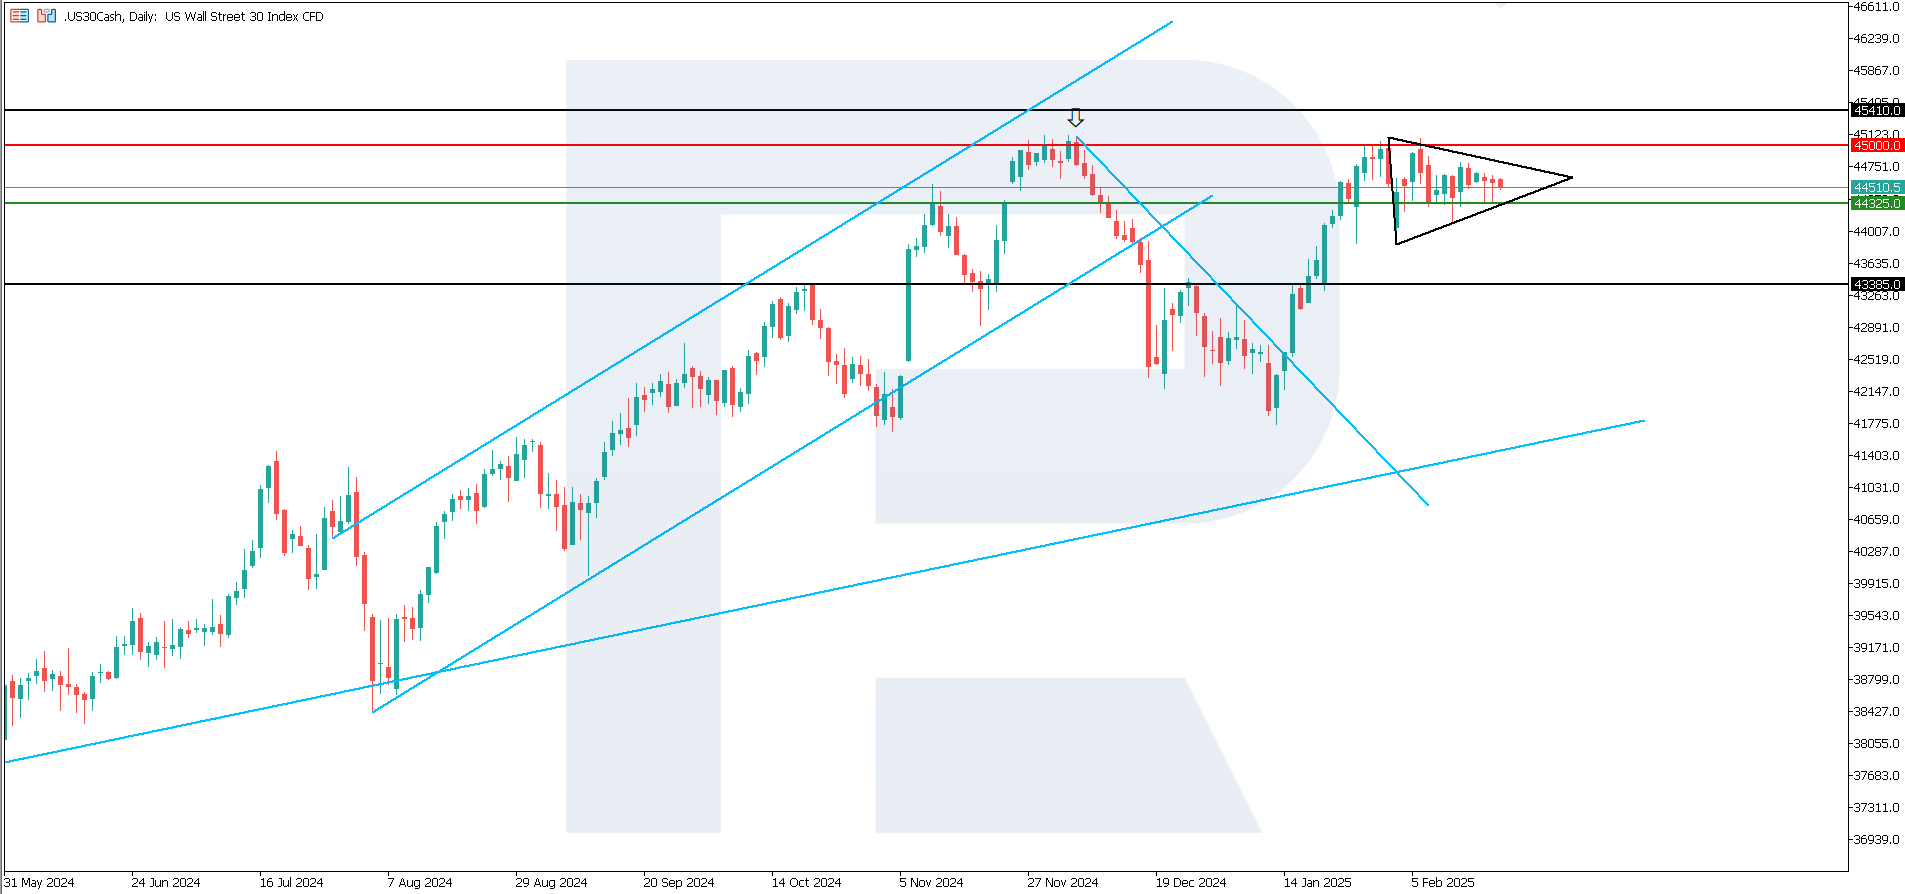
The US 30 stock index remains within a horizontal range, while there is still a possibility of a breakout above its upper boundary at 45,000.0. However, this scenario looks unlikely in the short term.
The following scenarios are considered for the US 30 price forecast:
- Pessimistic US 30 forecast: a breakout below the 44,325.0 support level could send the index down to 43,385.0
- Optimistic US 30 forecast: a breakout above the 45,000.0 resistance level could drive the index to 45,410.0
US 500 technical analysis
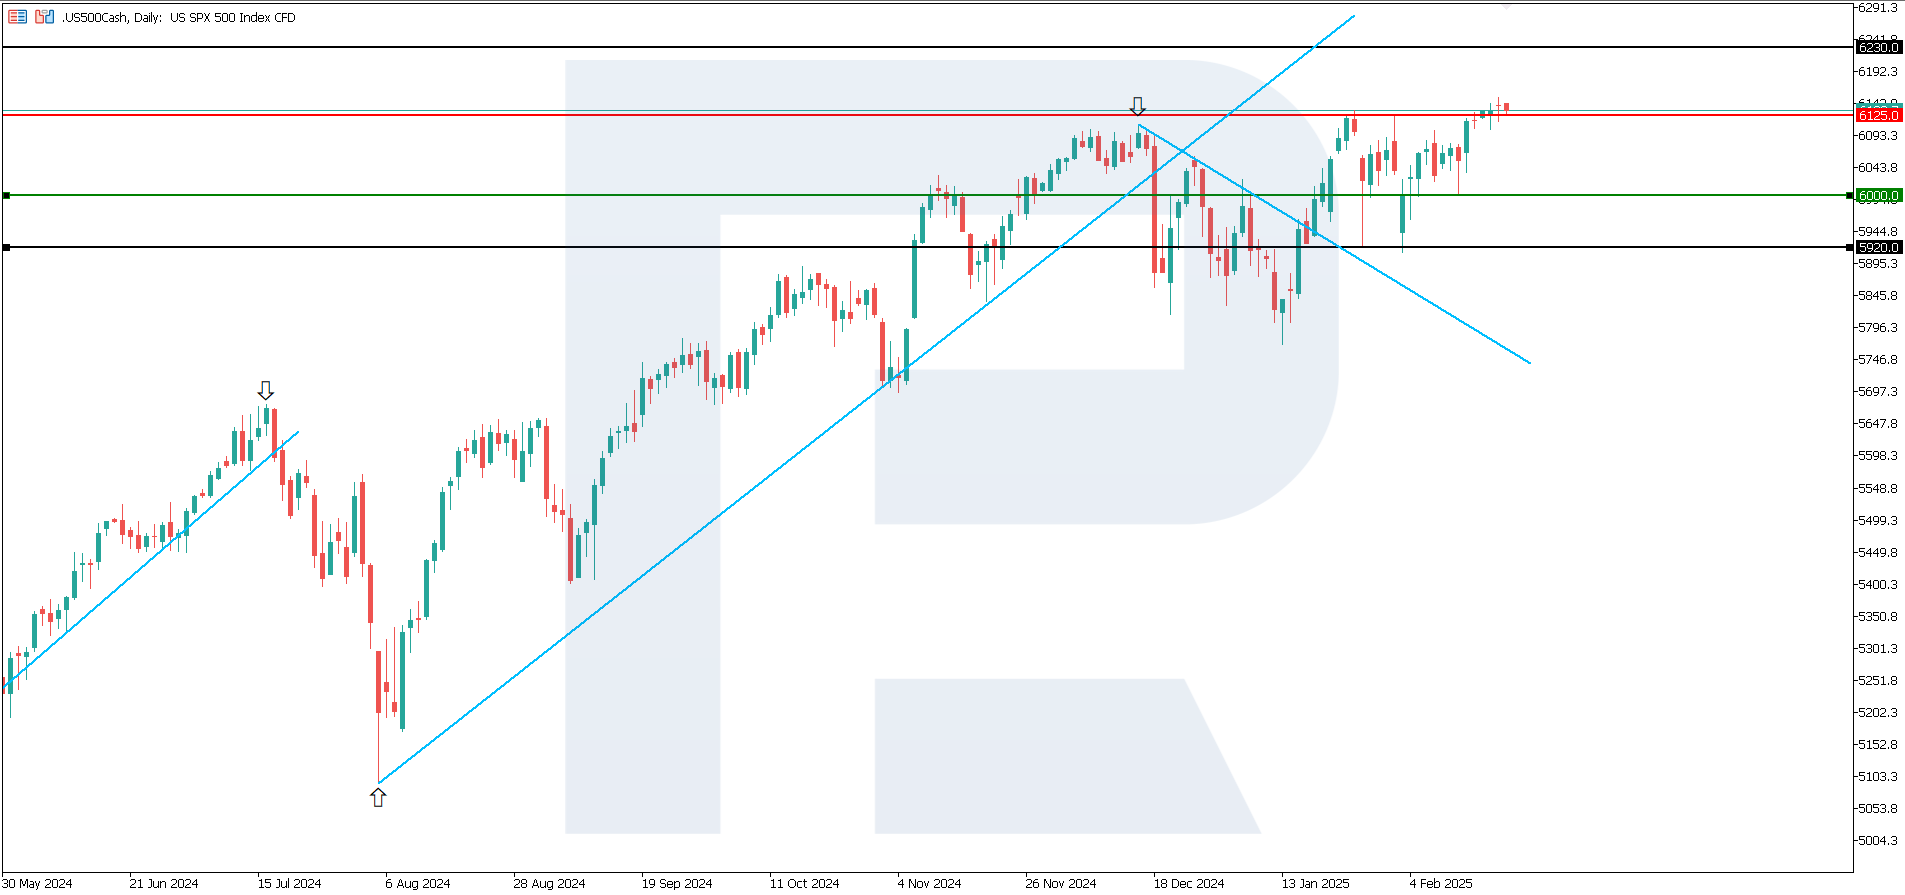
The US 500 stock index reached a new all-time high. However, the buyers are not strong enough to form a stable uptrend. The asset will highly likely see a correction in the short term.
The following scenarios are considered for the US 500 price forecast:
- Pessimistic US 500 forecast: a breakout below the 6,000.0 support level could push the index down to 5,920.0
- Optimistic US 500 forecast: if the price consolidates above the previously breached resistance level at 6,125.0, it could rise to 6,230.0
US Tech technical analysis
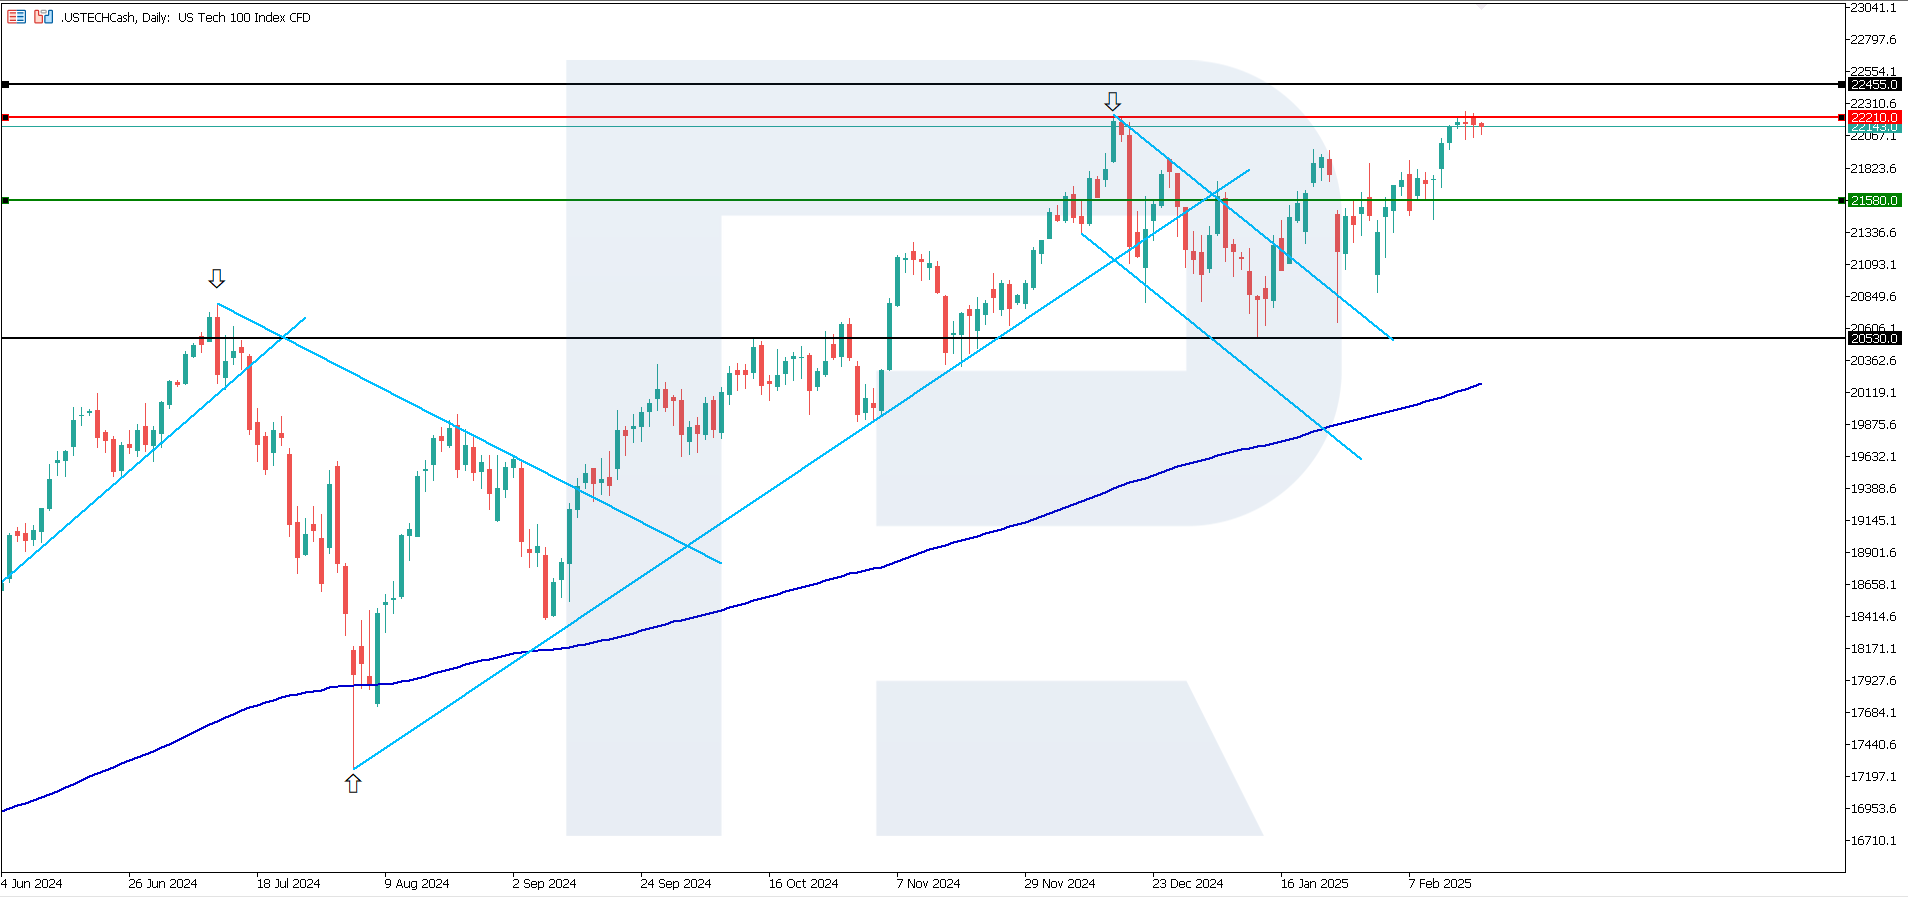
The US Tech stock index is close to its record high, having already broken above the key resistance level at 21,935.0. However, technical indicators show that the upward momentum is weakening. In the short term, a correction is most likely, potentially triggering a downtrend.
The following scenarios are considered for the US Tech price forecast:
- Pessimistic US Tech forecast: a breakout below the 21,580.0 support level could send the index down to 20,530.0
- Optimistic US Tech forecast: if the price consolidates above the previously breached resistance level at 21,935.0, it could climb to 22,455.0
Asian index forecast: JP 225
- Recent data: Bank of Japan Policy Board member Hajime Takata announced a further key rate hike
- Market impact: rate-sensitive stock market sectors are expected to decline
Fundamental analysis
Bank of Japan Policy Board Hajime Takata has been persistently hinting at a further rate hike, citing rising inflation expectations and companies actively passing on increased costs to consumers. This suggests that Japan’s monetary policy may tighten further.
Higher rates typically lead to higher borrowing costs for companies, potentially slowing down the pace of business expansion. Growth-oriented investors may become more cautious about stocks, which could cause some correction in the market. For the stock market, this usually means increased volatility and short-term pressure on quotes, especially in rate-dependent sectors.
JP 225 technical analysis
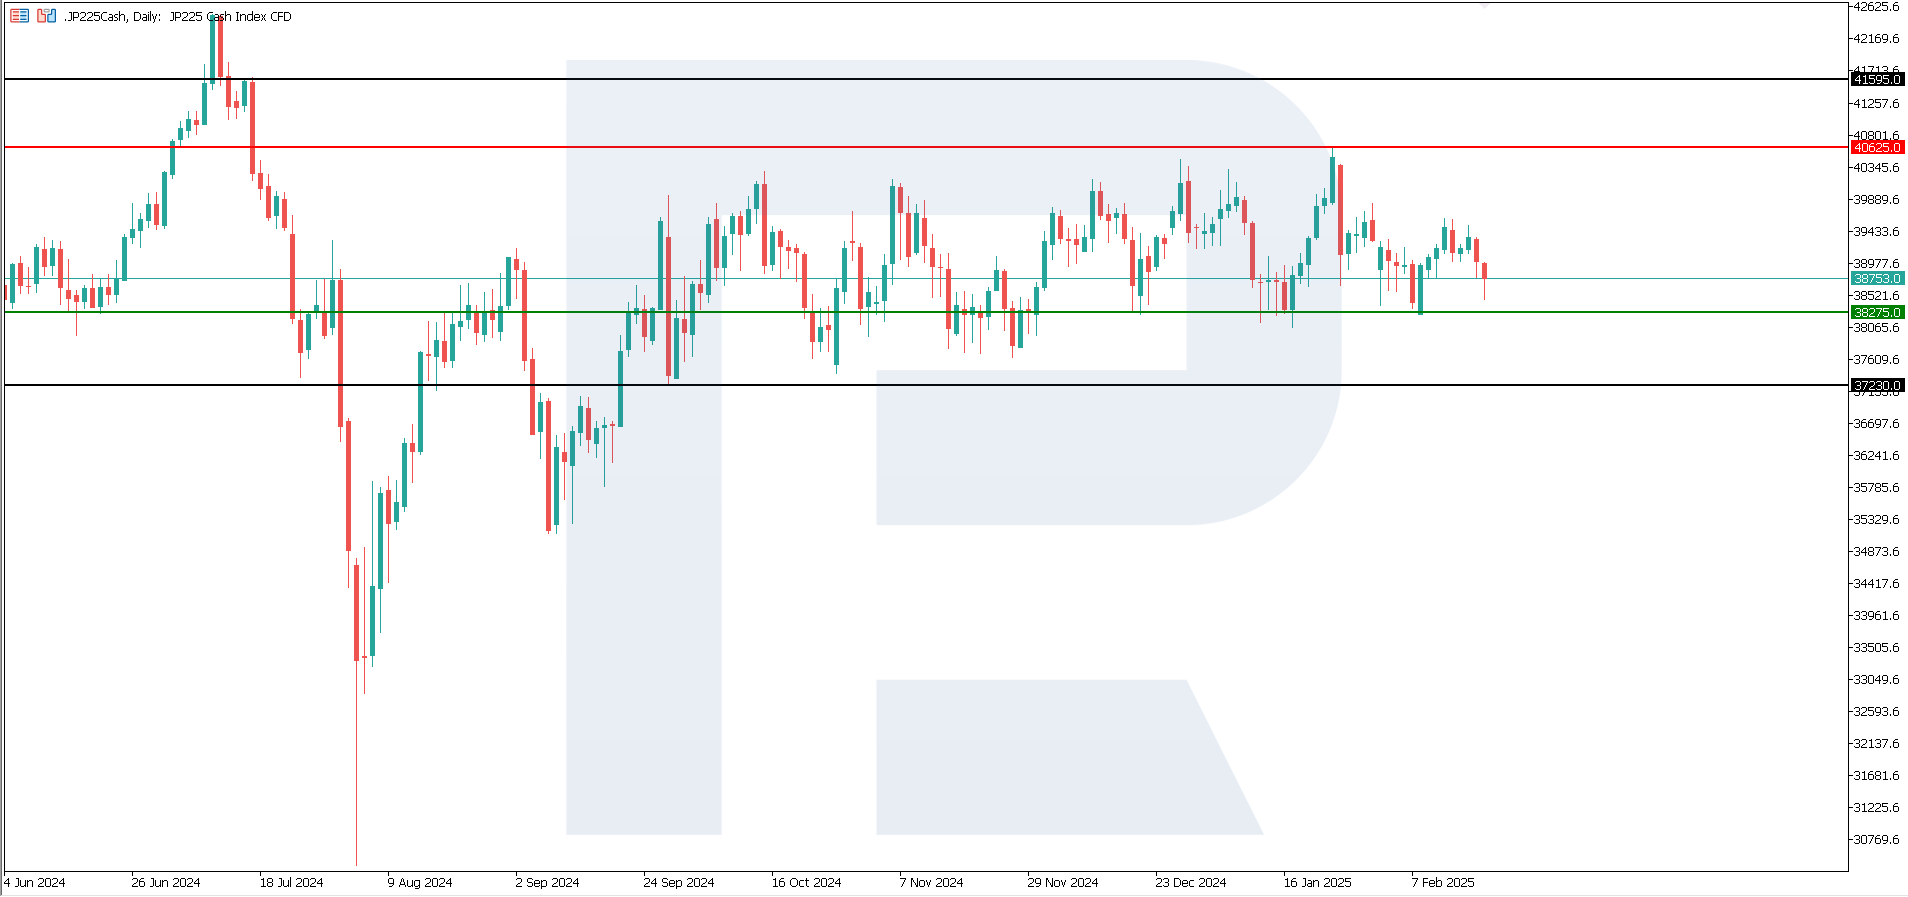
The JP 225 stock index headed towards the lower boundary of a consolidation range at 38,275.0. According to the current technical signals, a breakout below this level appears unlikely in the short term. Hence, the medium-term sideways trend could continue.
The following scenarios are considered for the JP 225 price forecast:
- Pessimistic JP 225 forecast: a breakout below the 38,275.0 support level could push the index down to 37,230.0
- Optimistic JP 225 forecast: a breakout above the 40,625.0 resistance level could propel the index to 41,595.0
European index forecast: DE 40
- Recent data: Germany’s services PMI was 52.5 in January
- Market impact: growth in the services sector supports stocks of companies focused on the domestic market
Fundamental analysis
Germany’s services PMI came in at 52.5 in January. A PMI reading above 50.0 indicates growing business activity in the services sector. Therefore, a reading of 52.5 shows that the German services sector grew in January. This is a positive signal, indicating improved business sentiment and increased demand for services in the country.
Positive dynamics in the services sector typically serve as an additional growth driver for the stock market as it points to stable domestic demand and improving economic conditions in one of Europe’s leading economies. If the PMI declines in subsequent reports or is significantly worse than expected, investor confidence in sustained growth could be shaken.
DE 40 technical analysis
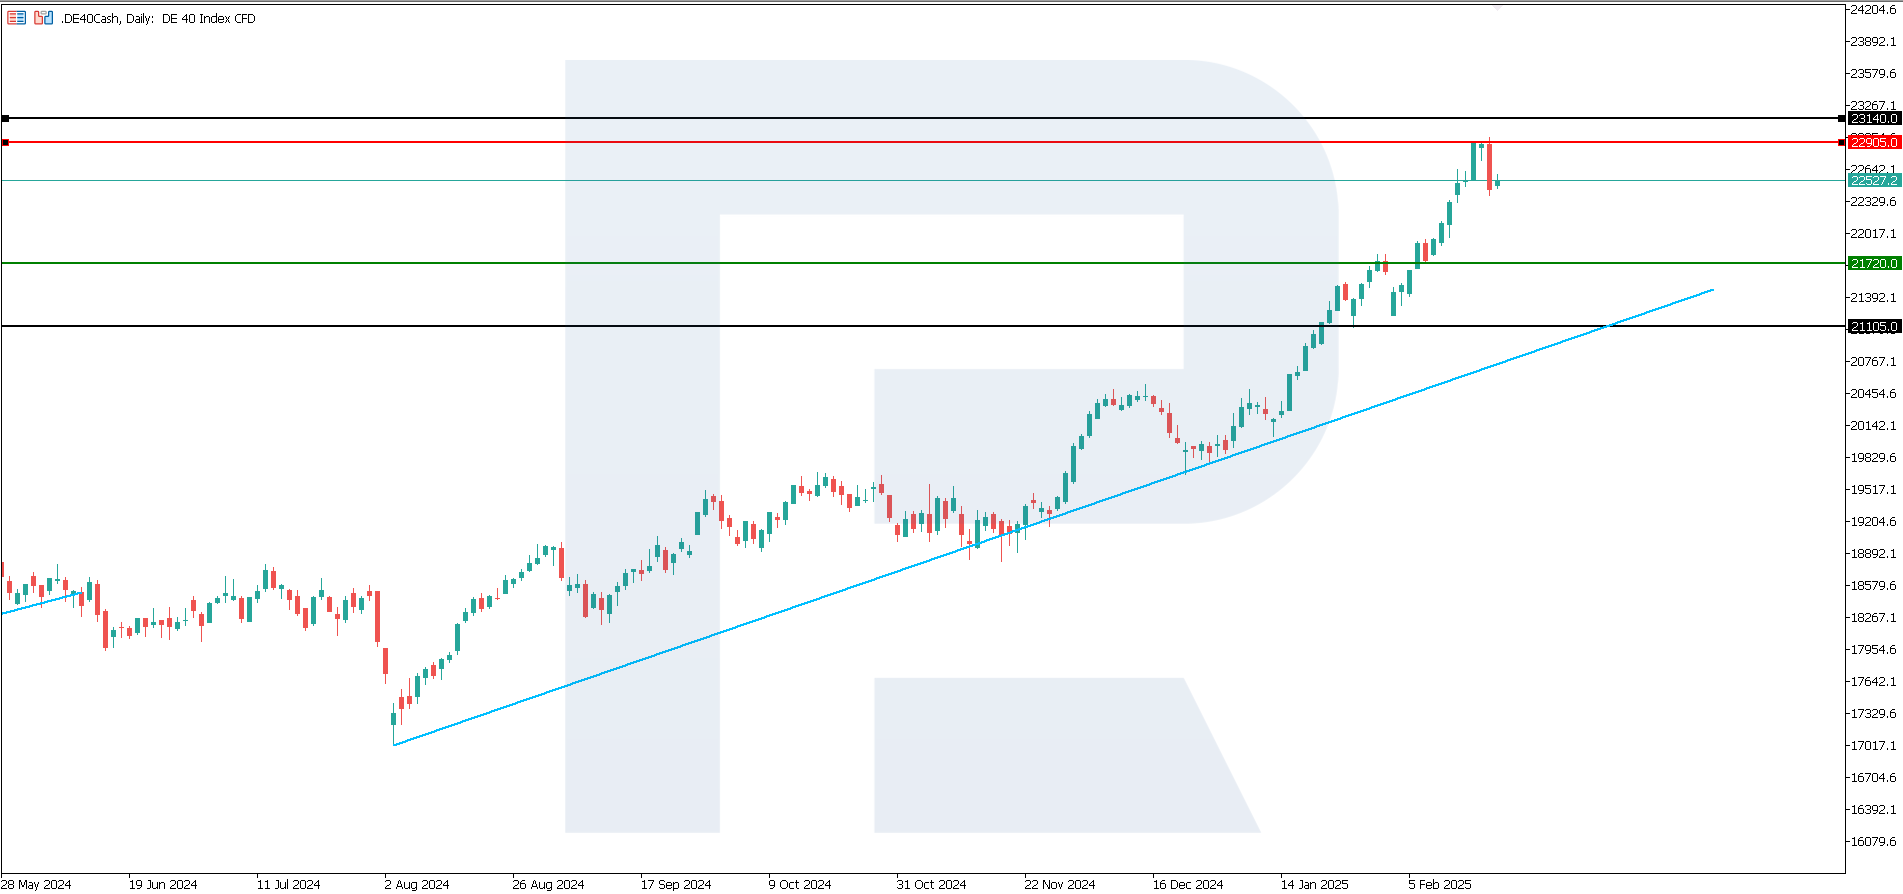
After a series of new all-time highs, the DE 40 stock index corrected by nearly 2.5%, which is a rather significant fall for one trading session. Nevertheless, the index is still in an uptrend. As the DE 40 technical analysis shows, the index will highly likely hit another all-time high after the correction is complete.
The following scenarios are considered for the DE 40 price forecast:
- Pessimistic DE 40 forecast: a breakout below the 21,720.0 support level could send the index down to 21,105.0
- Optimistic DE 40 forecast: a breakout above the 22,905.0 resistance level could propel the index to 23,140.0
Summary
The US 500 stock index has reached a new all-time high, the US Tech is still trading near its record high, while the US 30 index is aiming for a correction. The JP 225 index rushed towards the lower boundary of the sideways range. Following a 2.5% correction, the German DE 40 is poised to hit a new all-time high as it remains in an uptrend.
