World indices overview: news from US 30, US 500, US Tech, JP 225, and DE 40 for 22 May 2025
There is a decline in global stock indices, with some even reversing the trend to a downward one. Find out more in our analysis and forecast for global indices for 22 May 2025.
US indices forecast: US 30, US 500, US Tech
- Recent data: initial jobless claims came in at 229 thousand
- Market impact: since the reading was in line with the forecast and did not show an unexpected jump or decline, it is unlikely to have a direct impact on the market
Fundamental analysis
The indicator remained unchanged from last week, aligning with analysts’ expectations. This indicates a stable labour market, with neither deterioration nor improvement seen at this stage. A reading below 250-270 thousand is considered healthy for the US labour market, with resilience around 229 thousand confirming that layoffs are not getting bigger yet.
A 20-year US Treasury bond auction for 16 billion USD was disappointing. Demand was sluggish as investors wanted to buy bonds at lower prices. Bond yields surged to 5.047%, above the expected 5.035%, marking the second time in history when 20-year securities yielded more than 5%.
US 30 technical analysis
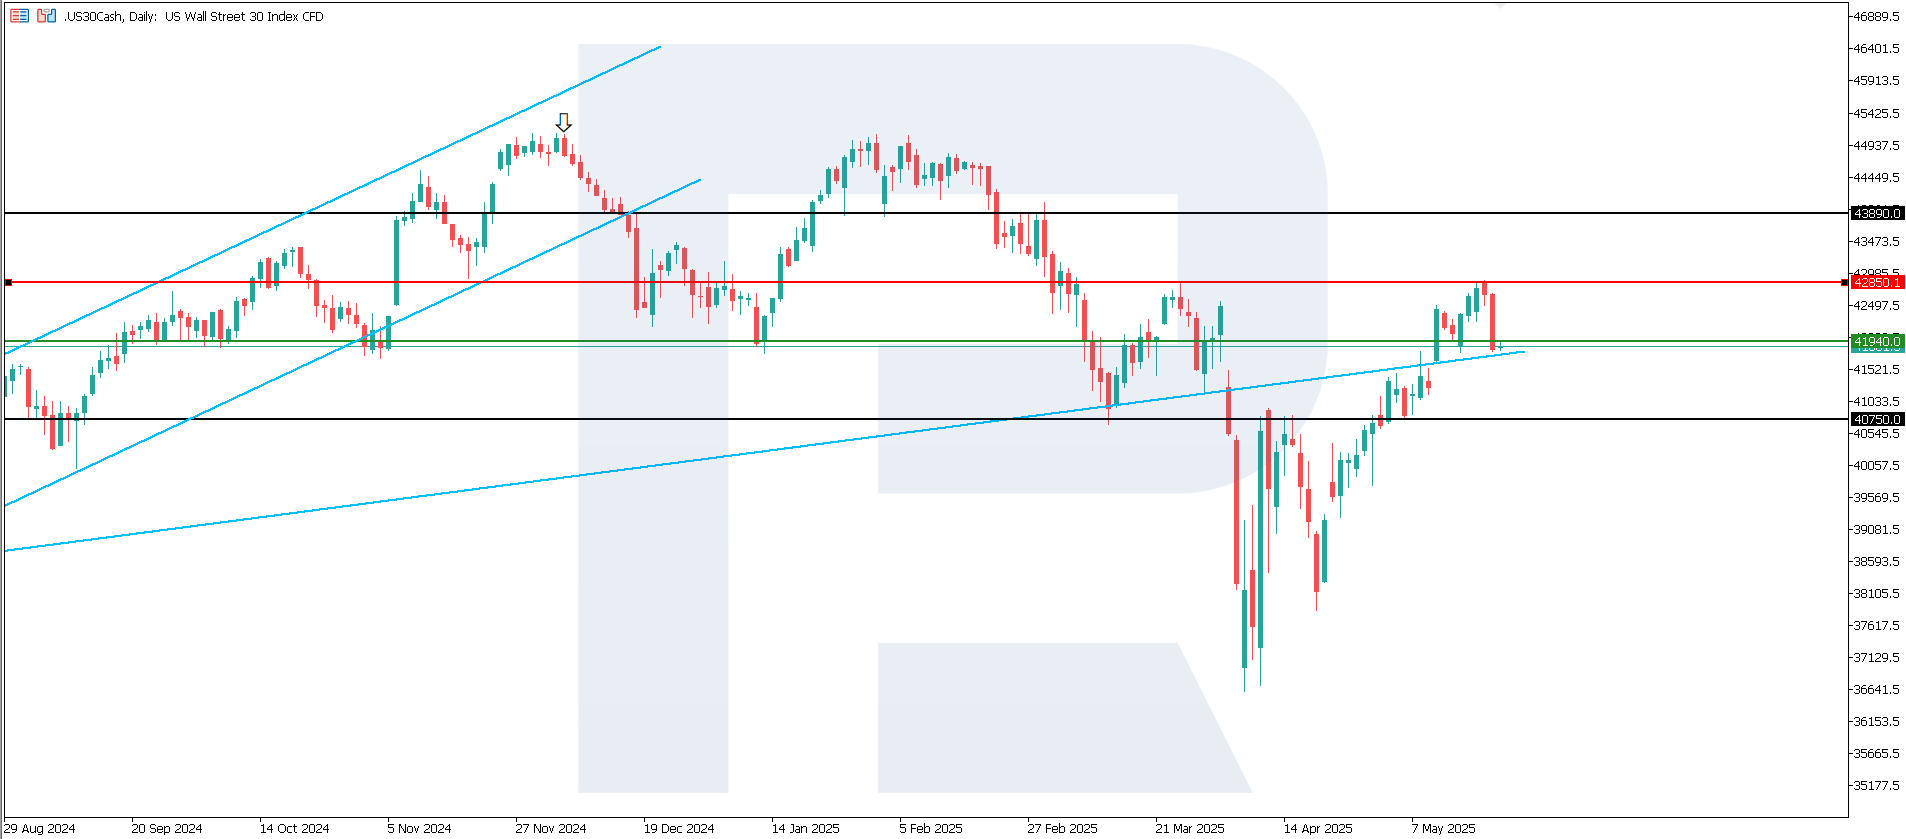
The US 30 index broke below the recently formed support level at 41,940.0, with resistance shifting to 42,850.0. It was premature to talk about an uptrend. With the situation in the US 30 uncertain, it is too early to draw conclusions before the price consolidates below the breached support level.
The following scenarios are considered for the US 30 price forecast:
- Pessimistic US 30 forecast: if the price consolidates below the previously breached support level at 41,940.0, the index could fall 40,750.0
- Optimistic US 30 forecast: a breakout above the 42,850.0 resistance level could drive the index to 43,890.0
US 500 technical analysis
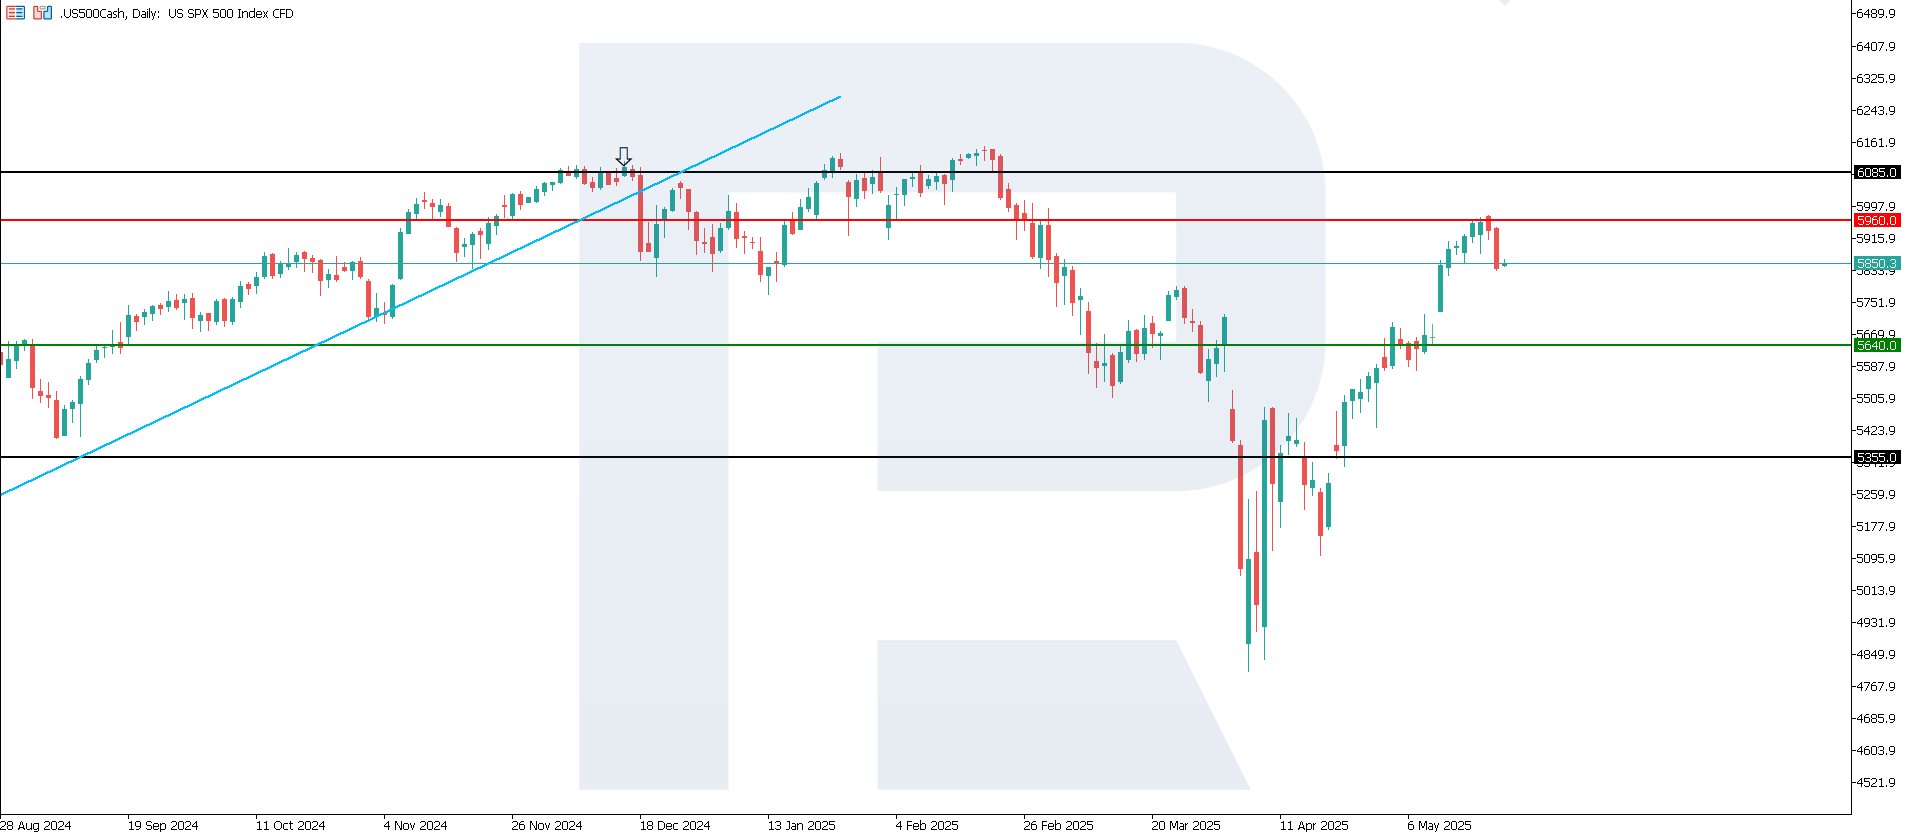
The US 500 index began to correct. The support level has shifted to 5,640.0, with resistance formed at 5,960.0. The price is likely to undergo a minor correction without a trend reversal and continue its upward trajectory. The current uptrend may become medium-term.
The following scenarios are considered for the US 500 price forecast:
- Pessimistic US 500 forecast: a breakout below the 5,640.0 support level could send the index down to 5,355.0
- Optimistic US 500 forecast: a breakout above the 5,960.0 resistance level could propel the index to 6,085.0
US Tech technical analysis
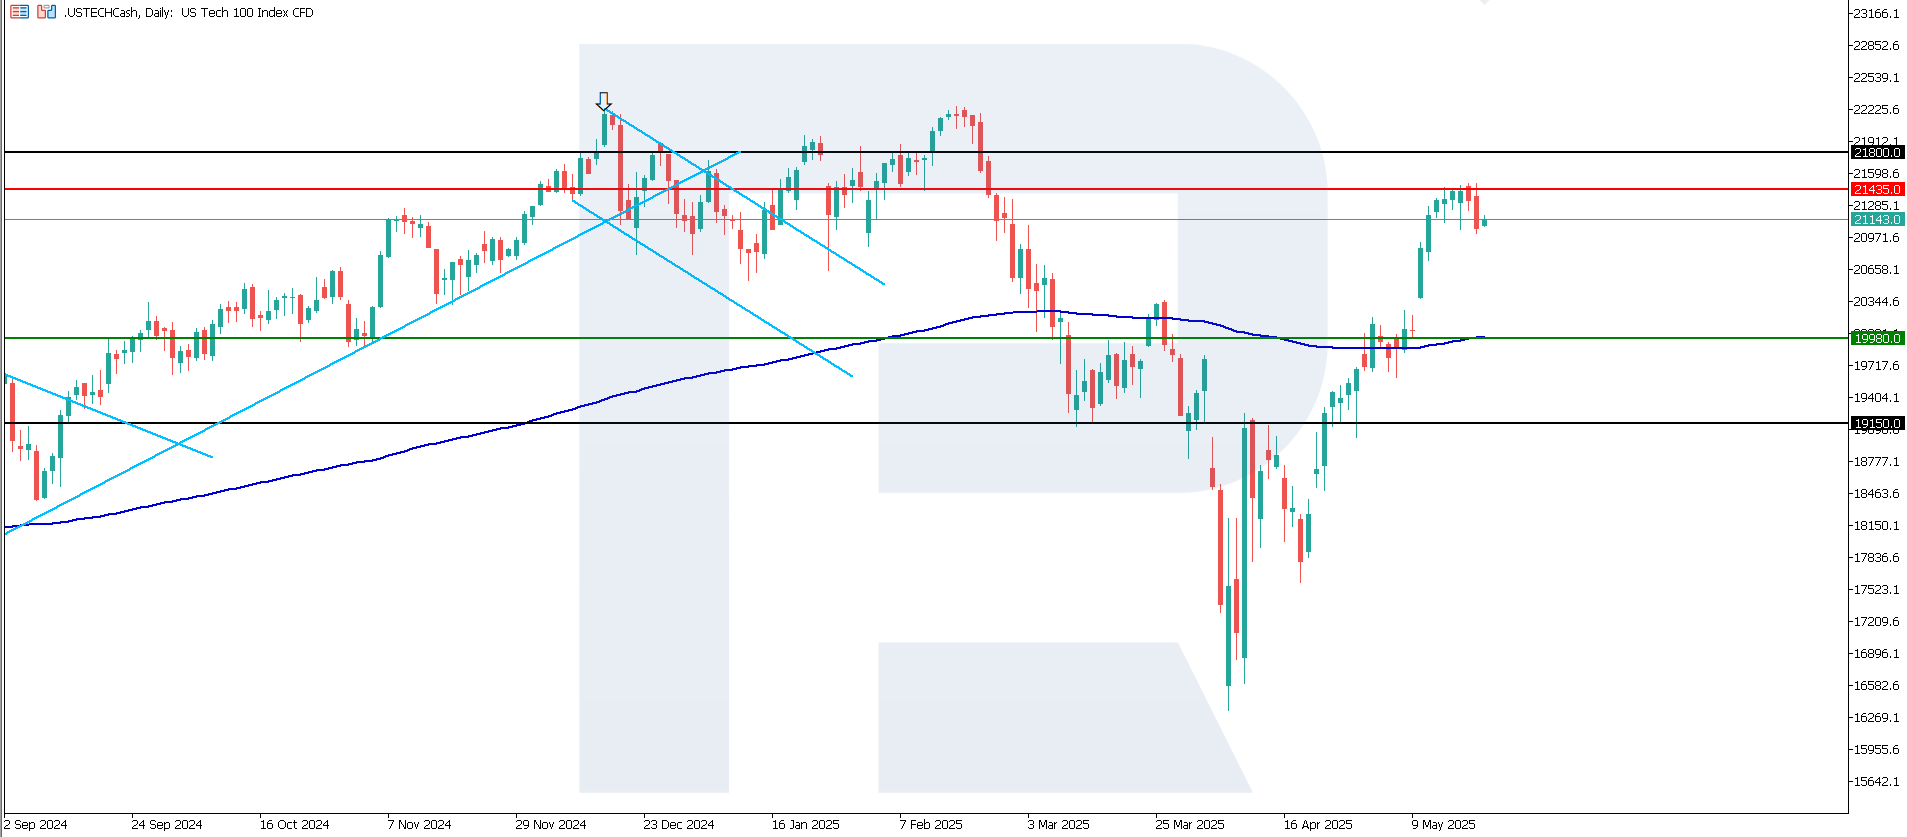
The US Tech index has formed a resistance level at 21,435.0, while the support line has moved to 19,980.0. The price is hovering above the 200-day Moving Average, signalling potential further growth. The current movement may develop into a sustainable medium-term uptrend.
Scenarios for the US Tech index price forecast:
- Pessimistic US Tech forecast: a breakout below the 19,980.0 support level could push the index down to 19,150.0
- Optimistic US Tech forecast: a breakout above the 21,435.0 resistance level could boost the index to 21,800.0
Asian index forecast: JP 225
- Recent data: Japan’s trade balance showed a deficit of 115.8 billion JPY
- Market impact: this may lead to a decline in stock indices in the short term, especially in industrial and technology sectors
Fundamental analysis
Japan’s trade balance shows the difference between exports and imports. A positive balance (surplus) means the country sells more than it buys, typically indicating strong foreign trade. A negative balance (deficit), as in this case 115.8 billion JPY, shows that imports exceed exports.
This data is highly negative for the Japanese stock market in the short term as it can trigger sell-offs in export-dependent sectors, increase pressure on the yen, and add to market volatility in anticipation of comments from the government or the Bank of Japan.
JP 225 technical analysis
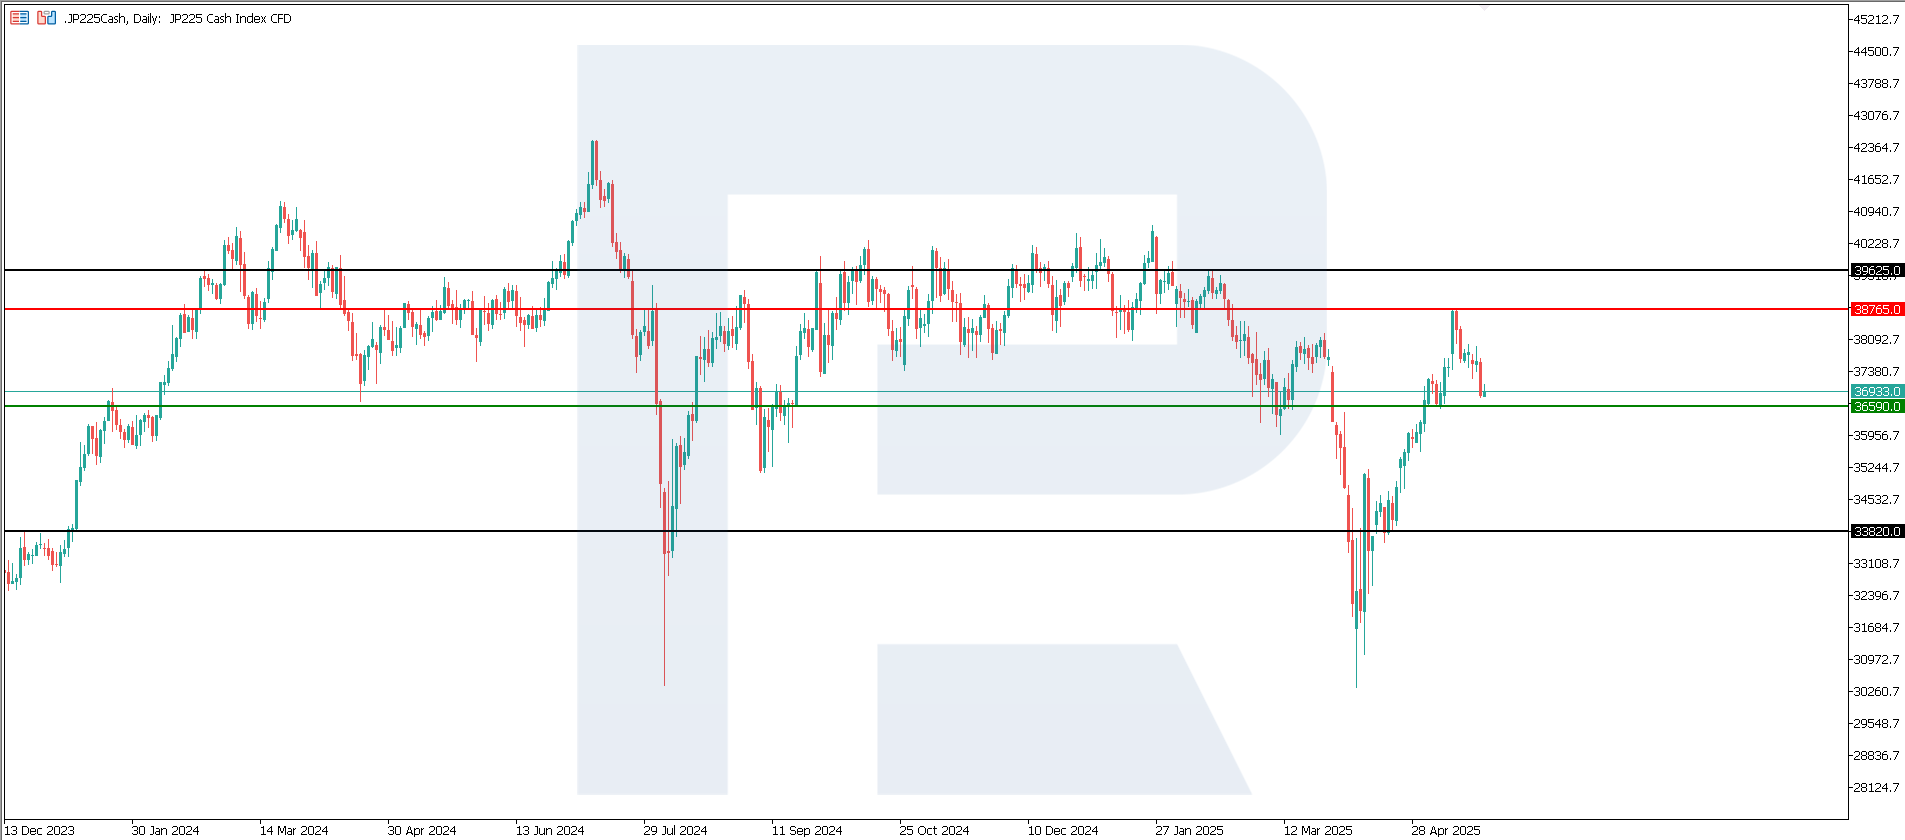
The JP 225 index left a medium-term sideways range, breaking above the 38,130.0 resistance level. This could signal the beginning of a bullish reversal. However, a false breakout is possible. A new resistance level formed at 38,765.0, which strengthens the signs of an upward movement.
The following scenarios are considered for the JP 225 price forecast:
- Pessimistic JP 225 forecast: a breakout below the 36,590.0 support level could push the index down to 33,820.0
- Optimistic JP 225 forecast: a breakout above the 38,765.0 resistance level could drive the index to 39,625.0
European index forecast: DE 40
- Recent data: Germany’s PPI was preliminarily -0.6% in May
- Market impact: lower producer prices may be perceived as a signal of easing inflationary pressures
Fundamental analysis
A decline in the PPI increases the likelihood that the ECB will continue or accelerate monetary easing (for example, interest rate cuts). Policy easing is a favourable factor for the stock market as it reduces borrowing costs and encourages investment.
Investors will keep a close eye on macroeconomic data such as CPI, PMI, and exports to assess the sustainability of the German economic recovery. A protracted decline in prices could also be a signal of weakness in the real economy, especially in the manufacturing sector, potentially negatively impacting industrial, export, and capital goods stocks.
DE 40 technical analysis
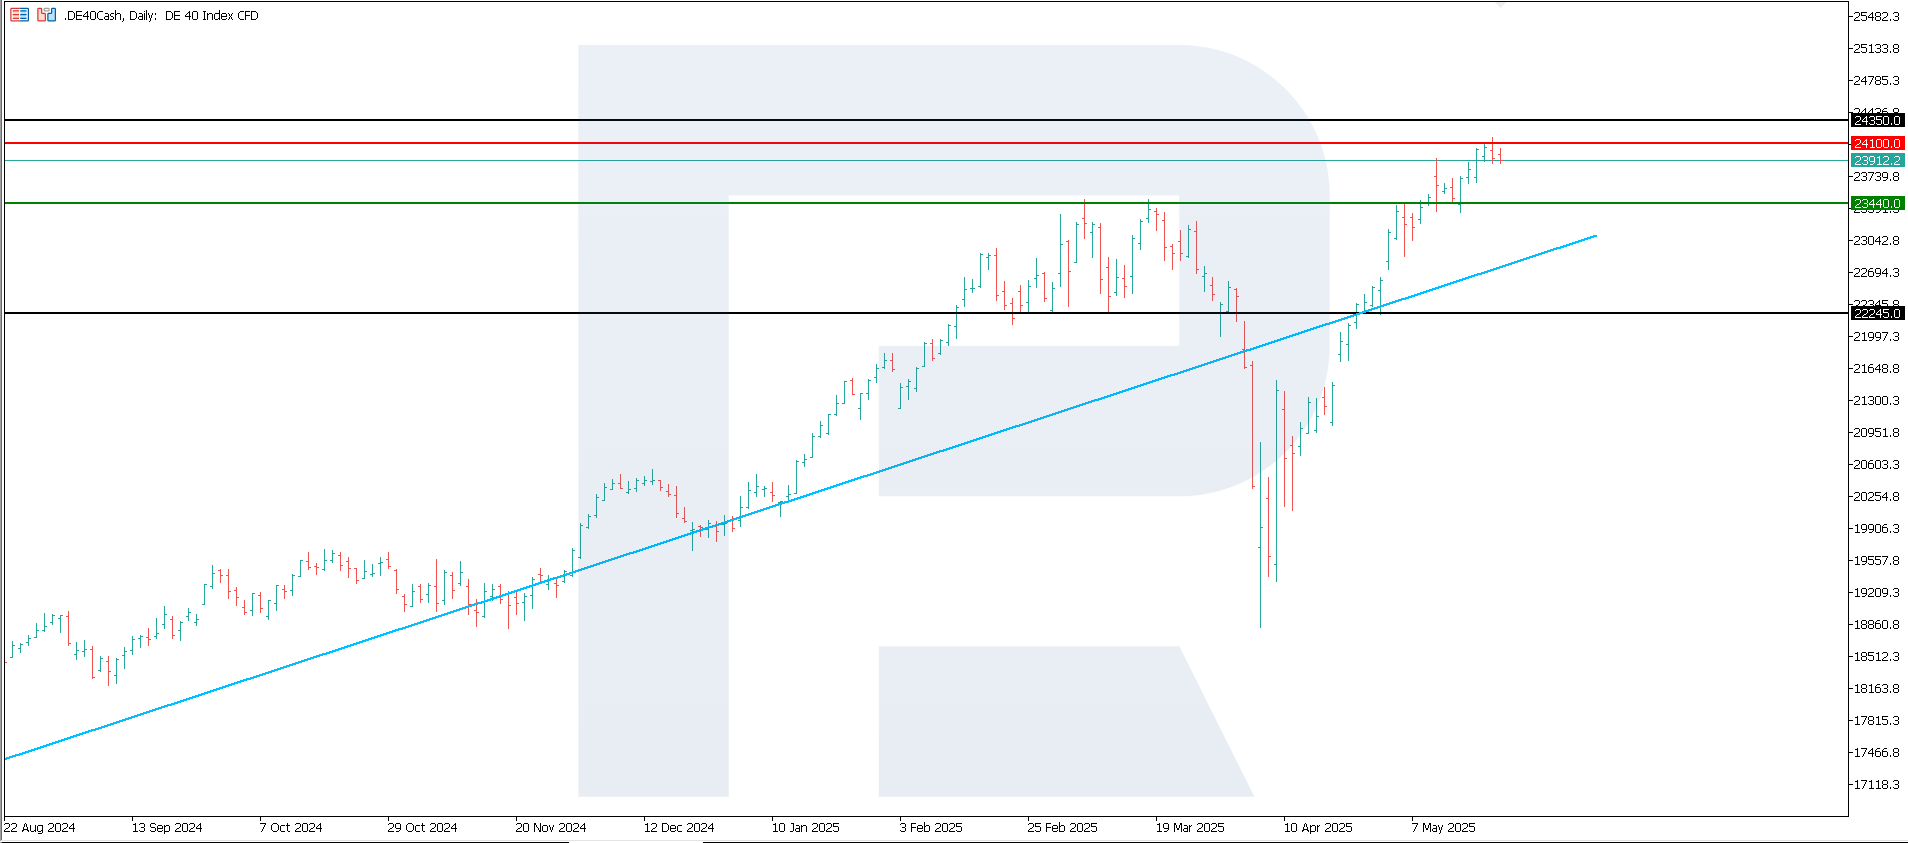
The DE 40 stock index formed a resistance level at 24,100.0, with support at 23,440.0. The price is now declining as part of a correction. A new growth cycle could continue.
The following scenarios are considered for the DE 40 price forecast:
- Pessimistic DE 40 forecast: a breakout below the 23,440.0 support level could send the index down to 22,245.0
- Optimistic DE 40 forecast: a breakout above the 24,100.0 resistance level could propel the index to 24,345.0
Summary
Following a disappointing 20-year US Treasury bond auction, most global indices started a corrective decline. The US 30 has broken below the support level again, poised to reverse the emerging uptrend. The fall in the JP 225 index was driven by a negative foreign trade balance, which is an adverse signal for the entire Japanese economy.
