World indices overview: news from US 30, US 500, US Tech, JP 225, and DE 40 for 3 June 2025
The US executive branch continues its clash with the judiciary, which has begun to overturn new tariffs on China and the EU. Find out more in our analysis and forecast for global indices for 3 June 2025.
US indices forecast: US 30, US 500, US Tech
- Recent data: US Q1 2025 GDP declined by 0.2% quarter-over-quarter
- Market impact: this may lower corporate earnings, particularly in cyclical sectors, such as finance, industry, and consumer goods
Fundamental analysis
Negative GDP dynamics indicate a potential cooling of economic activity. The actual result was better than the forecast of -0.3% but significantly worse than the previous figure of +2.4%. Weaker growth increases the likelihood that the Federal Reserve will delay further monetary tightening or even begin discussing easing, especially amid moderate inflation. This may support the stock market in the short term.
Investors may temporarily shift from growth-sensitive sectors, such as banks and industrial companies, to defensive ones (healthcare and utilities) and the technology sector, which benefits from lower interest rates.
US 30 technical analysis
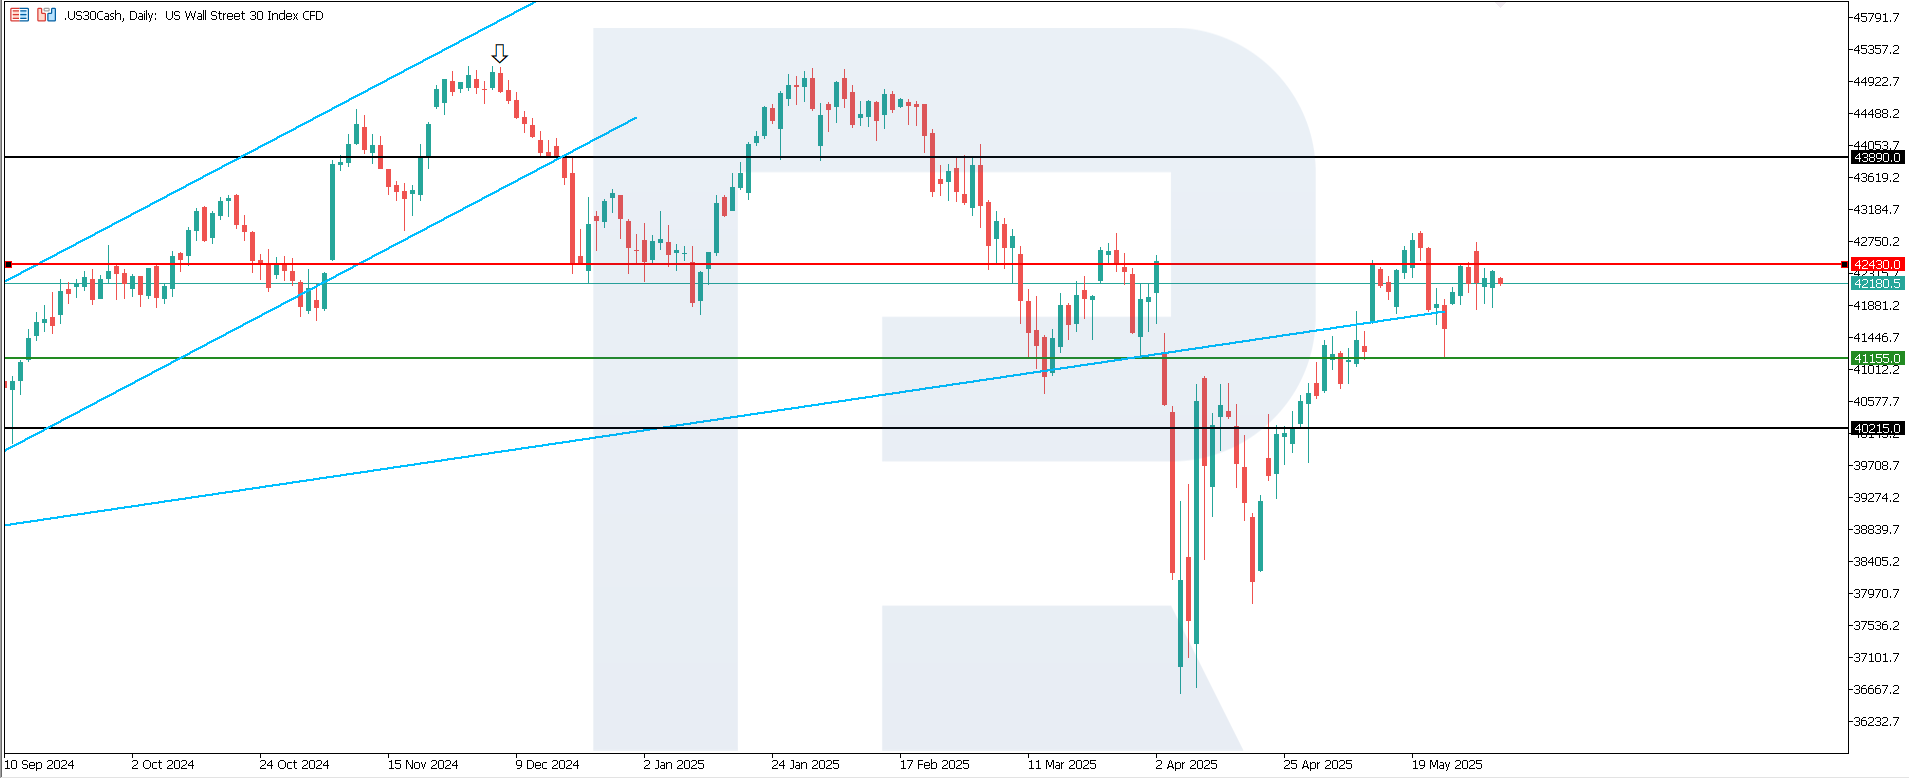
The US 30 index attempted to break above the recently formed resistance level at 42,430.0 but failed, with the support level remaining at 41,155.0. The US 30 outlook remains unstable, marking the third directional shift. Despite technical signs of an emerging uptrend, the likelihood of moving into a sideways range remains high. Breakouts from this range may occur without sustained continuation.
The following scenarios are considered for the US 30 price forecast:
- Pessimistic US 30 forecast: a breakout below the 41,155.0 support level could push the index to 40,215.0
- Optimistic US 30 forecast: a breakout above the 42,430.0 resistance level could drive the index to 43,890.0
US 500 technical analysis
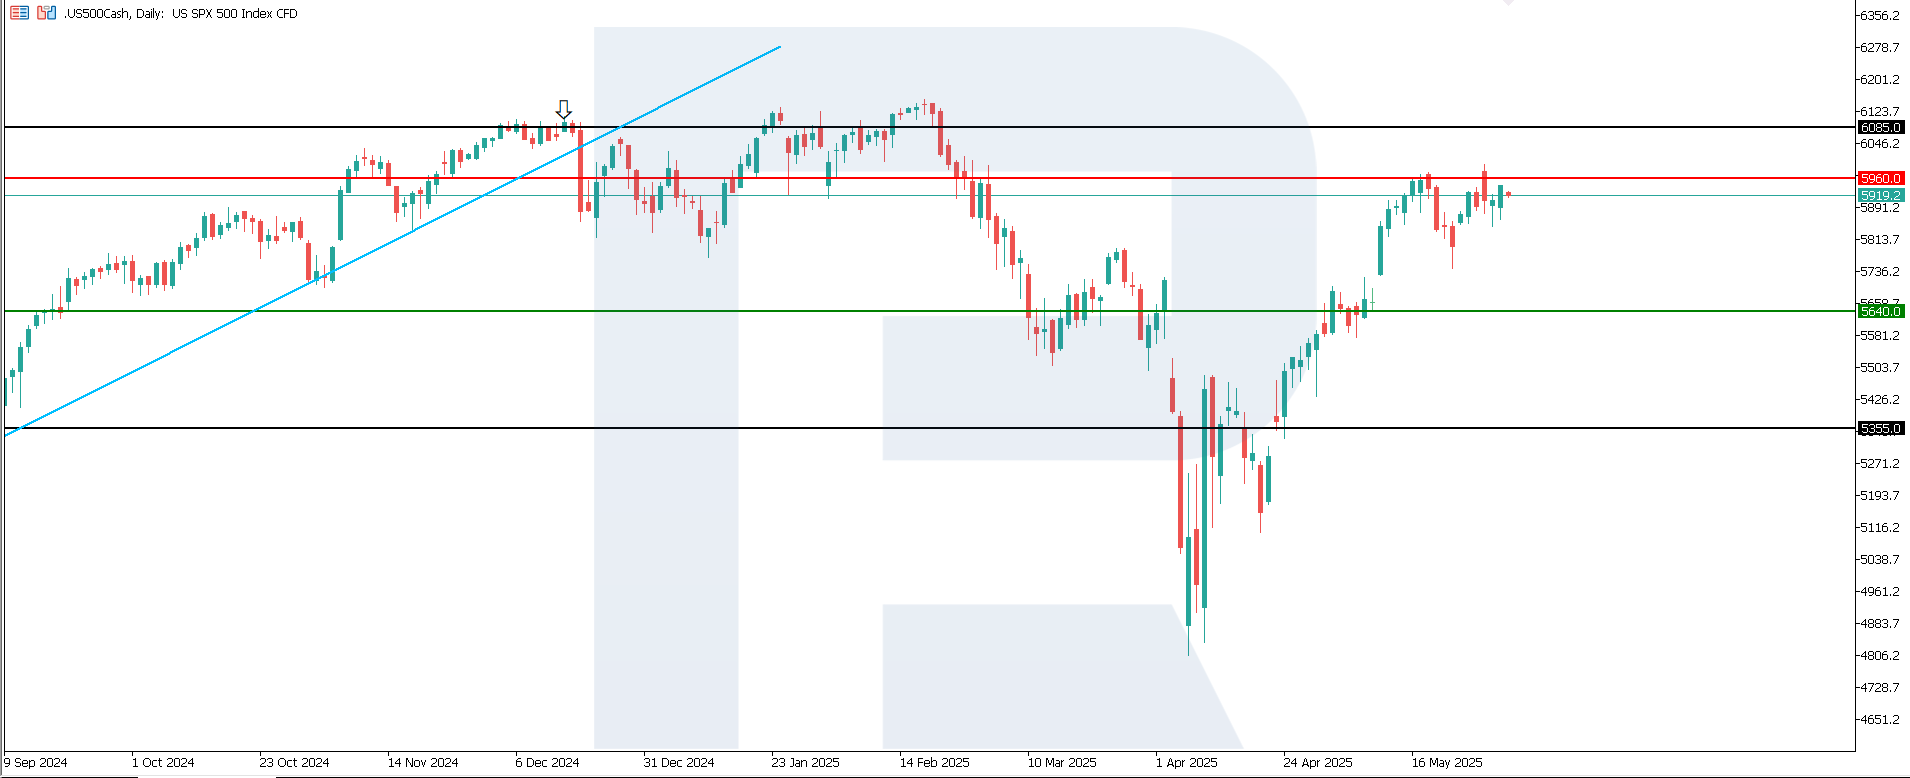
The US 500 index rose by 6% in May. Historically, there have been six instances where the SPX gained at least 5% in May. In 100% of those cases, the S&P 500 gained between 8% and 30% over the following 12 months. The US 500 index has entered a correction phase, with the support level shifting to 5,640.0, and the resistance line at 5,960.0. There is an upward momentum, potentially leading to a breakout above the current resistance level.
The following scenarios are considered for the US 500 price forecast:
- Pessimistic US 500 forecast: a breakout below the 5,640.0 support level could send the index down to 5,355.0
- Optimistic US 500 forecast: a breakout above the 5,960.0 resistance level could propel the index to 6,085.0
US Tech technical analysis
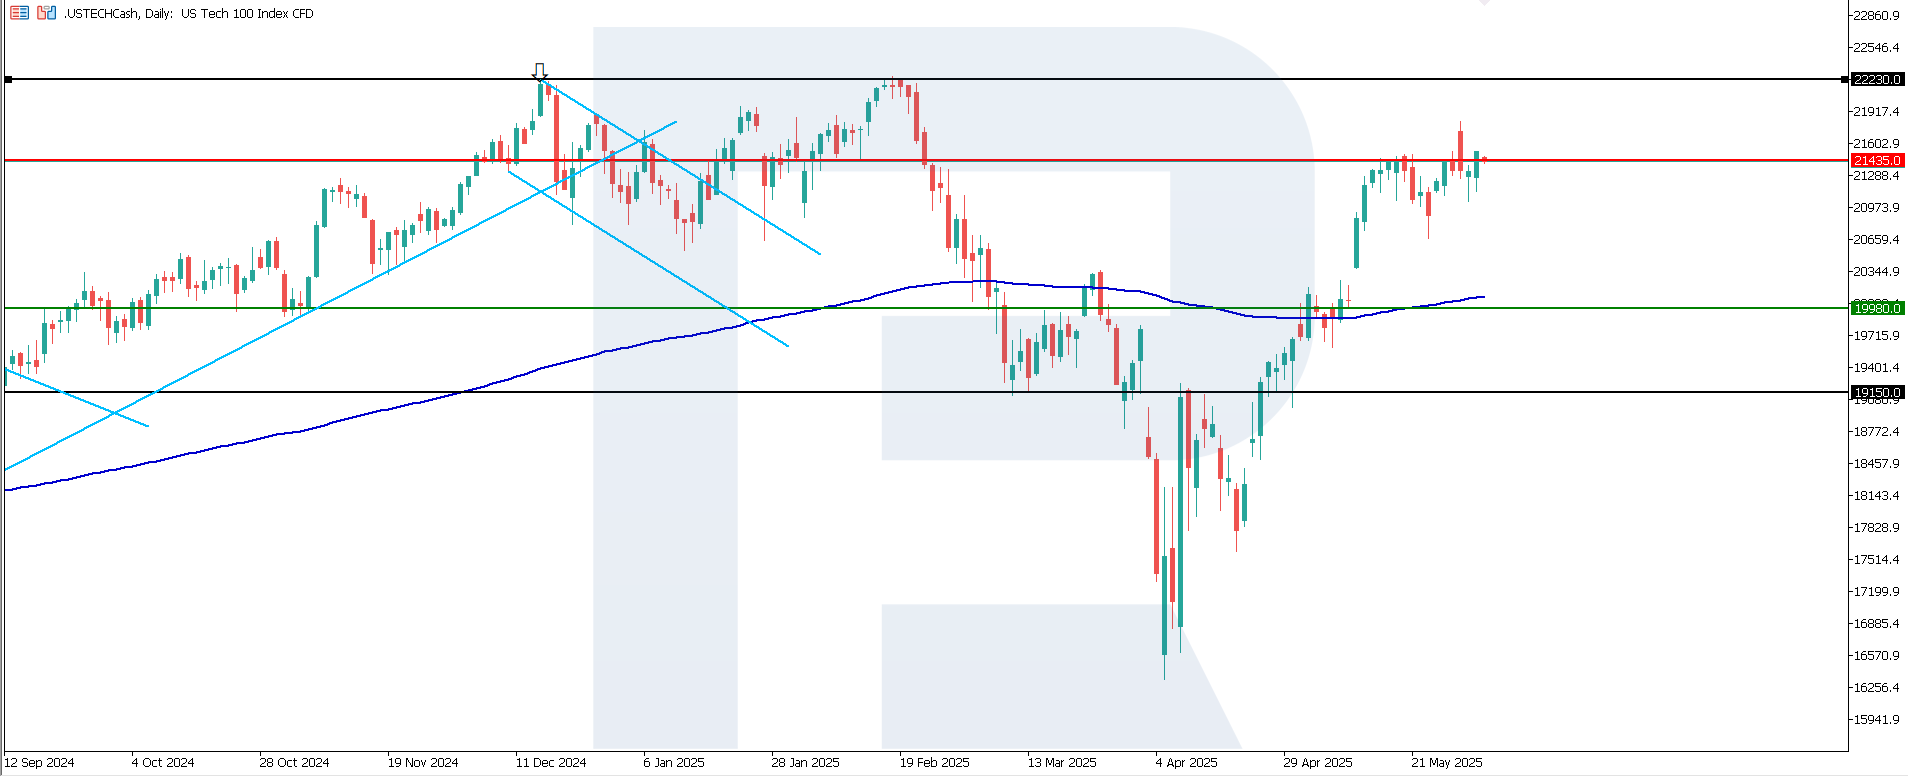
The US Tech index is holding steady above the 200-day Moving Average, confirming the resilience of the upward impulse. The support level has shifted to 19,980.0, while the resistance line is located at 21,435.0. If prices consolidate above this level, a stable medium-term uptrend will likely form.
The following scenarios are considered for the US Tech price forecast:
- Pessimistic US Tech forecast: a breakout below the 19,980.0 support level could push the index down to 19,150.0
- Optimistic US Tech forecast: if the price consolidates above the previously breached resistance level at 21,435.0, the index could climb to 22,230.0
Asian index forecast: JP 225
- Recent data: Japan’s industrial production fell by 0.9% in May
- Market impact: since the decline was less severe than expected, investors may interpret this as a sign of economic resilience and an ability to cope with current challenges
Fundamental analysis
A 0.9% decrease in industrial production signals a slowdown in business activity. Therefore, any positive reaction is likely to be moderate and short-lived, especially if not followed by other strong indicators such as export or consumption data. These figures do not exert urgent pressure on the Bank of Japan to change monetary policy, which may support a stimulative environment for equities.
The data impact on the stock market is likely to be limited, with US-Japan negotiations on a new trade agreement potentially being of more importance.
JP 225 technical analysis
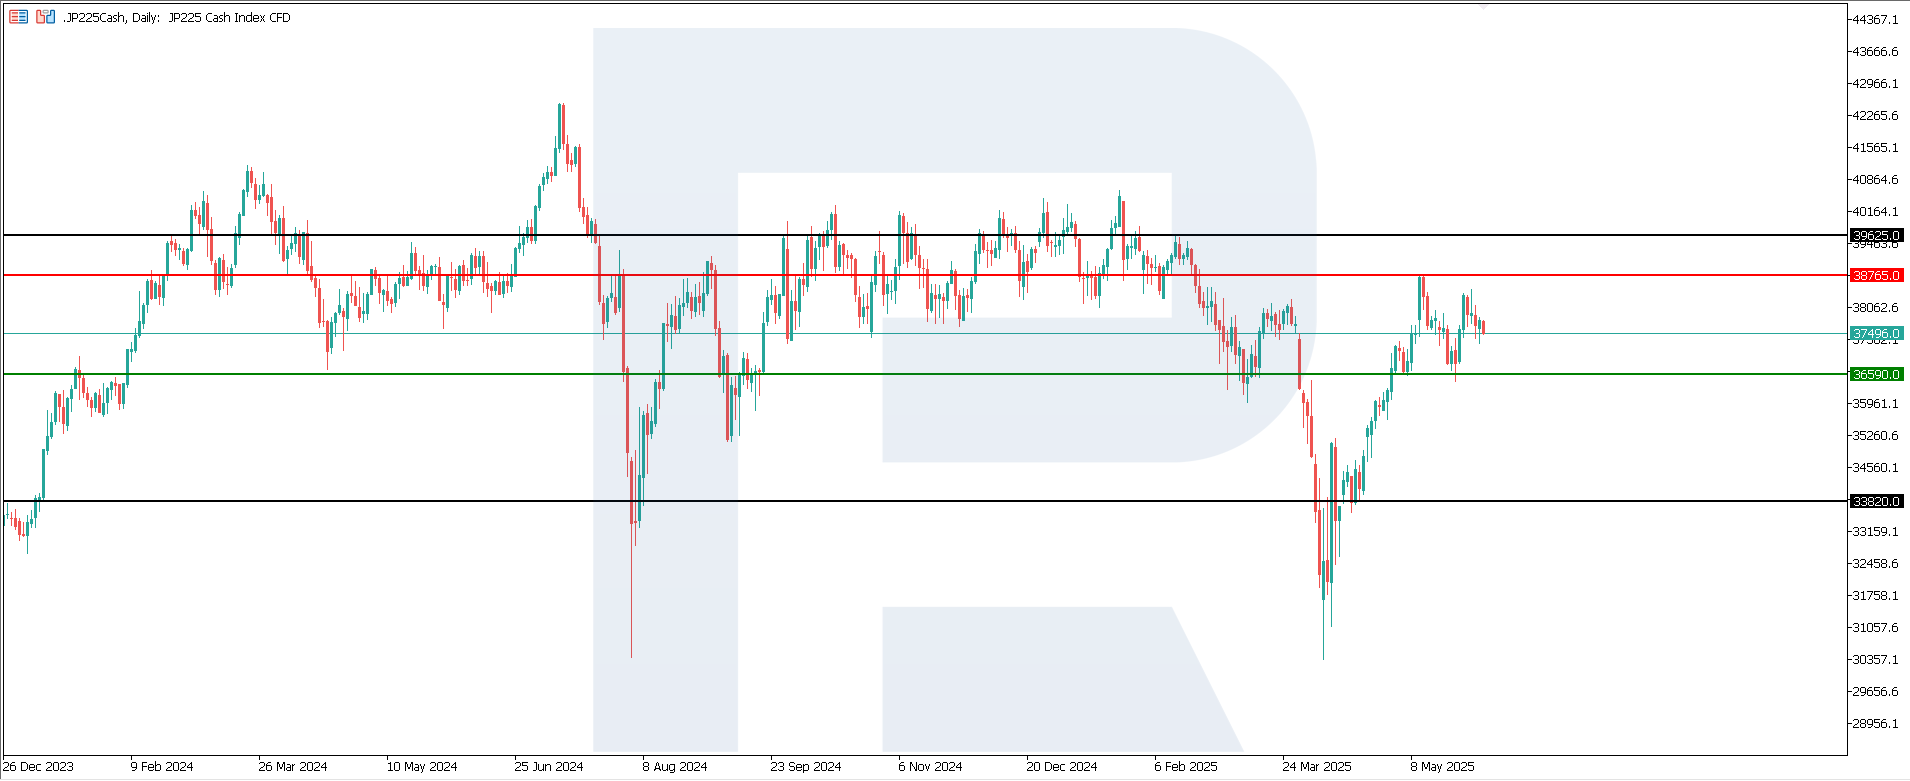
The JP 225 index has rebounded from the 36,590.0 support level and is headed towards resistance at 38,765.0. A breakout above this level will confirm the continuation of the previously formed medium-term uptrend. Currently, there are no signs of a trend reversal.
The following scenarios are considered for the JP 225 price forecast:
- Pessimistic JP 225 forecast: a breakout below the 36,590.0 support level could push the index down to 33,820.0
- Optimistic JP 225 forecast: a breakout above the 38,765.0 resistance level could drive the index to 39,625.0
European index forecast: DE 40
- Recent data: Germany’s Consumer Price Index (CPI) rose by 0.1% in May 2025
- Market impact: since the figure was in line with expectations, it lowers the likelihood of monetary tightening by the European Central Bank, which is favourable for the stock market
Fundamental analysis
The figure in line with the forecast signals predictability in inflation processes and the absence of price shocks. A slowdown compared to the previous month indicates easing inflationary pressures. Rate-sensitive sectors, such as real estate, technology, and consumer goods, may gain additional support from slowing inflation.
Overall, this data may help sustain the uprend in the German stock market, provided no new external economic risks arise. Therefore, the outcome of the US-EU tariff talks will be decisive.
DE 40 technical analysis
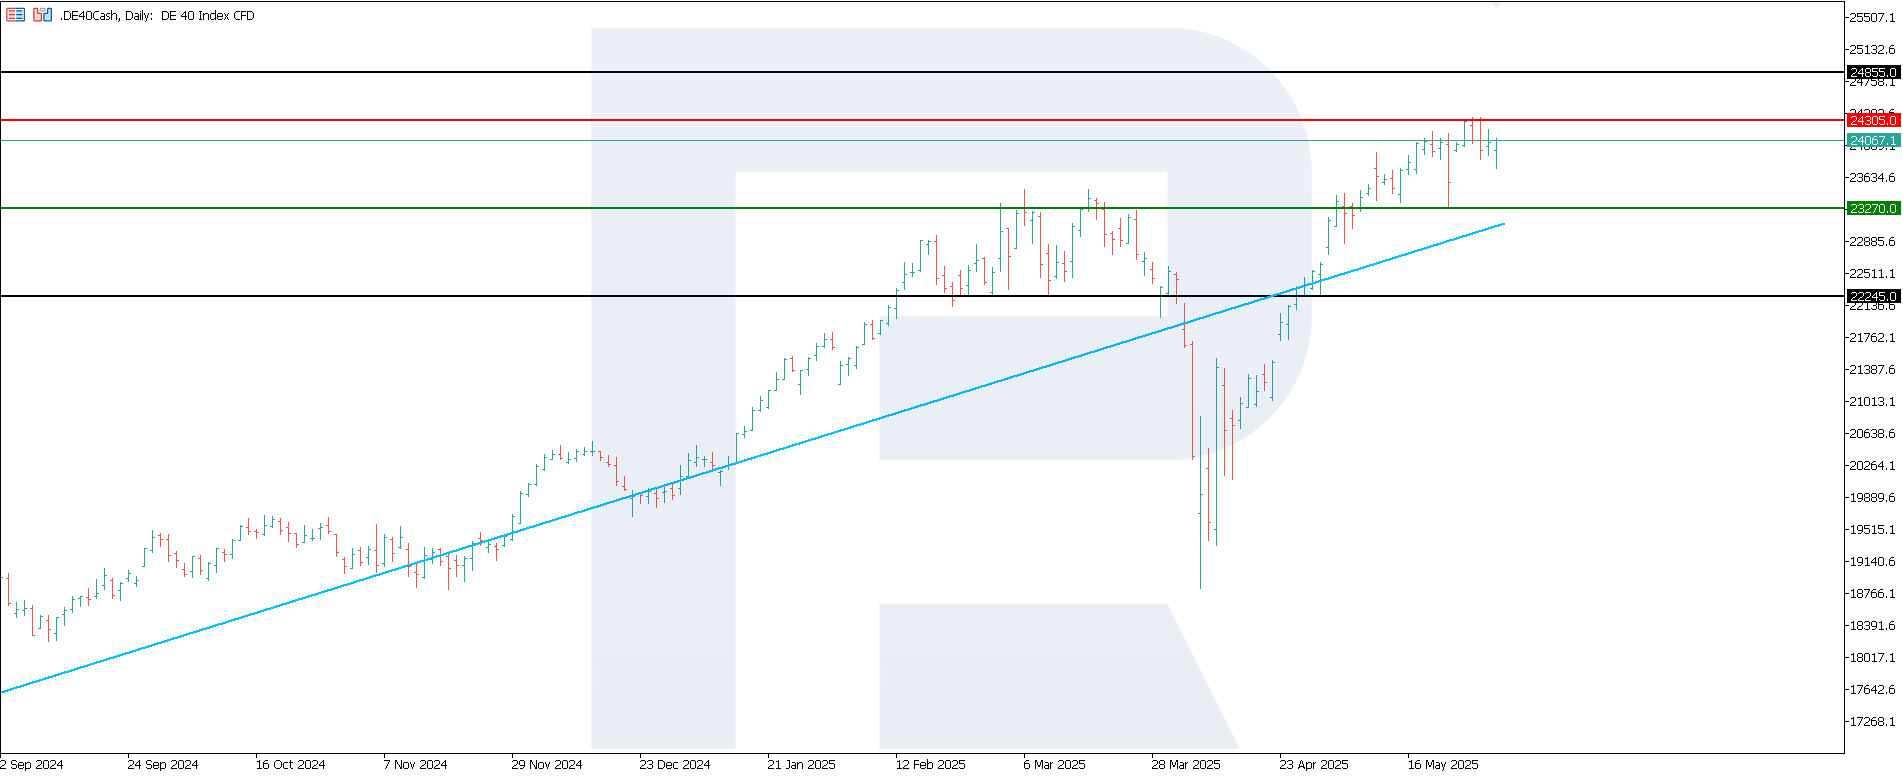
The DE 40 index has formed key levels, with resistance at 24,305.0 and support around 23,270.0. The current market dynamics confirm the strengthening uptrend, creating conditions for a potential new all-time high.
The following scenarios are considered for the DE 40 price forecast:
- Pessimistic DE 40 forecast: a breakout below the 23,270.0 support level could send the index down to 22,245.0
- Optimistic DE 40 forecast: a breakout above the 24,305.0 resistance level could propel the index to 24,855.0
Summary
The US court ruling to cancel several tariffs caused a positive response among investors. However, some existing duties on goods such as aluminium and steel remain in effect, as their implementation was not based on the International Emergency Economic Powers Act (IEEPA). The US 30 nearly broke above the resistance level and reversed the emerging downtrend. Japan’s JP 225 is rising towards its current resistance level. The US 500 and US Tech indices continue to trade in an uptrend, with Germany’s DE 40 aiming for another all-time high.
