GBPUSD, “Great Britain Pound vs US Dollar”
In the H4 chart, there was a divergence on MACD, which made the pair reverse downwards after reaching 61.8% fibo. By now, GBPUSD has almost reached the mid-term support at 1.2883. After completing the pullback, the instrument may start another rising wave towards 76.0% fibo at 1.3794.


The H1 chart shows the more detailed structure of the current descending correction. At the moment, the pair is getting close to 50.0% fibo at 1.2855 and may later reach 61.8% fibo at 1.2700. At the same time, there is convergence on MACD, which indicates a possible pullback after the price reaches one of its targets. The resistance is the high at 1.3514.

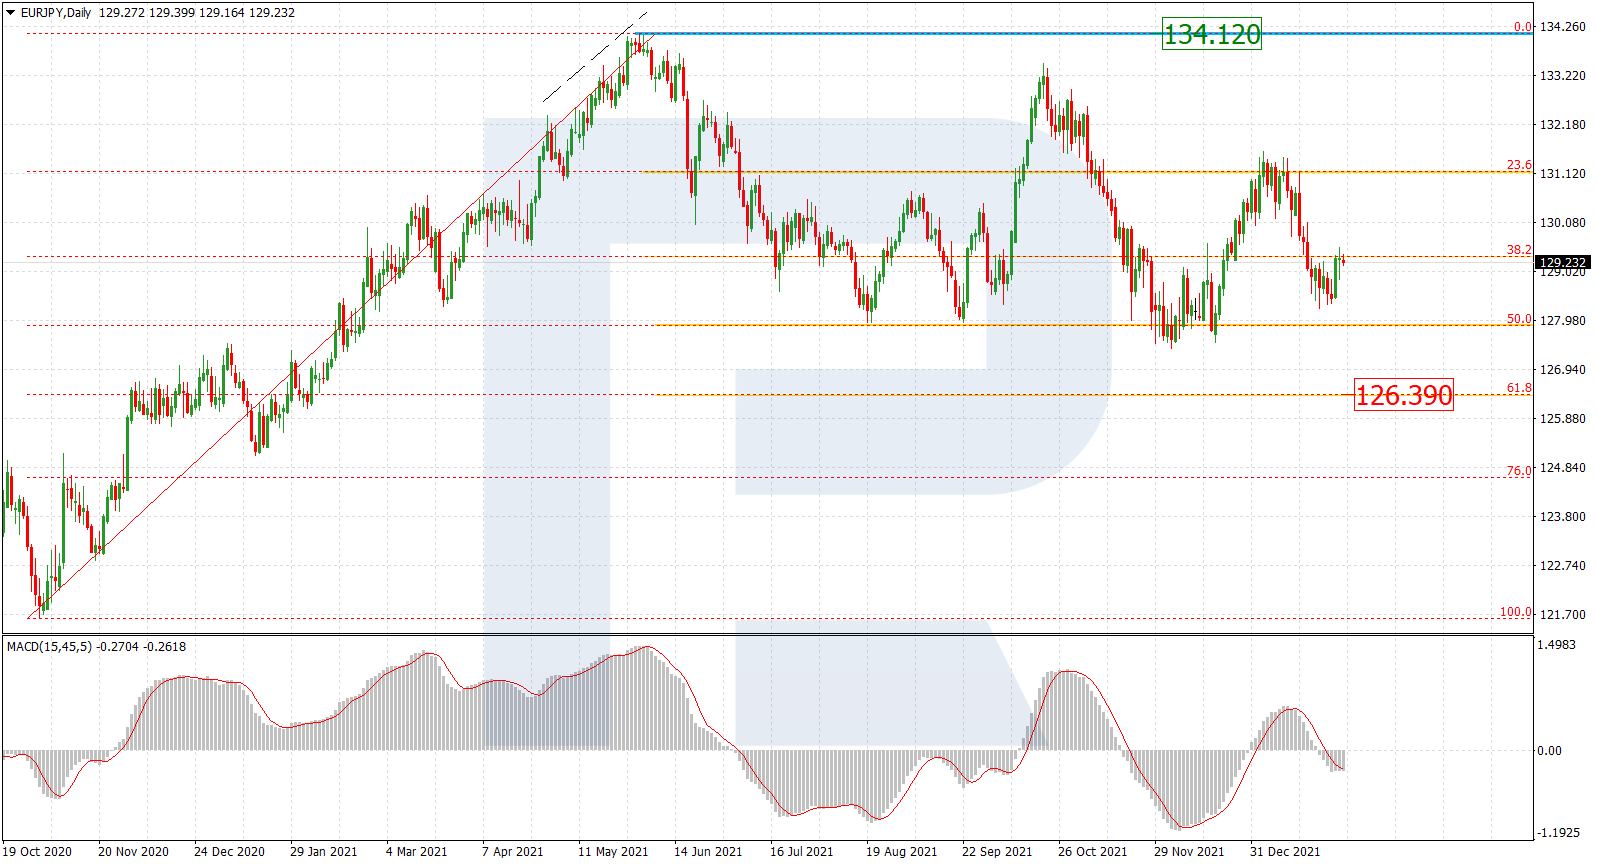
EURJPY, “Euro vs. Japanese Yen”
In the daily chart, there was a divergence on MACD, which made the pair reverse downwards after reaching 76.0% fibo. Right now, EURJPY is getting close to the local support, which is 61.8% fibo at 120.50. if later the price breaks it, the instrument will continue falling towards the low at 115.86.
As we can see in the H4 chart, the pair is correcting downwards after finishing the rising impulse. By now, it has almost reached 61.8% fibo at 121.00. The next downside target may be 76.0% fibo at 120.63. if the price breaks the fractal support at 119.99, the mid-term tendency may reverse. Otherwise, the instrument may break the resistance at 122.65 and continue the mid-term uptrend.

![Promotion Welcome 100 RU [https://welcome100.npbpromoru.nl/]](https://npbmedia.s3.eu-central-1.amazonaws.com/banners/ru/welcome100/300x250.jpg)