Daily technical analysis and forecast for 15 May 2025
Here is a detailed daily technical analysis and forecast for EURUSD, USDJPY, GBPUSD, AUDUSD, USDCAD, XAUUSD and Brent for 15 May 2025.
EURUSD forecast
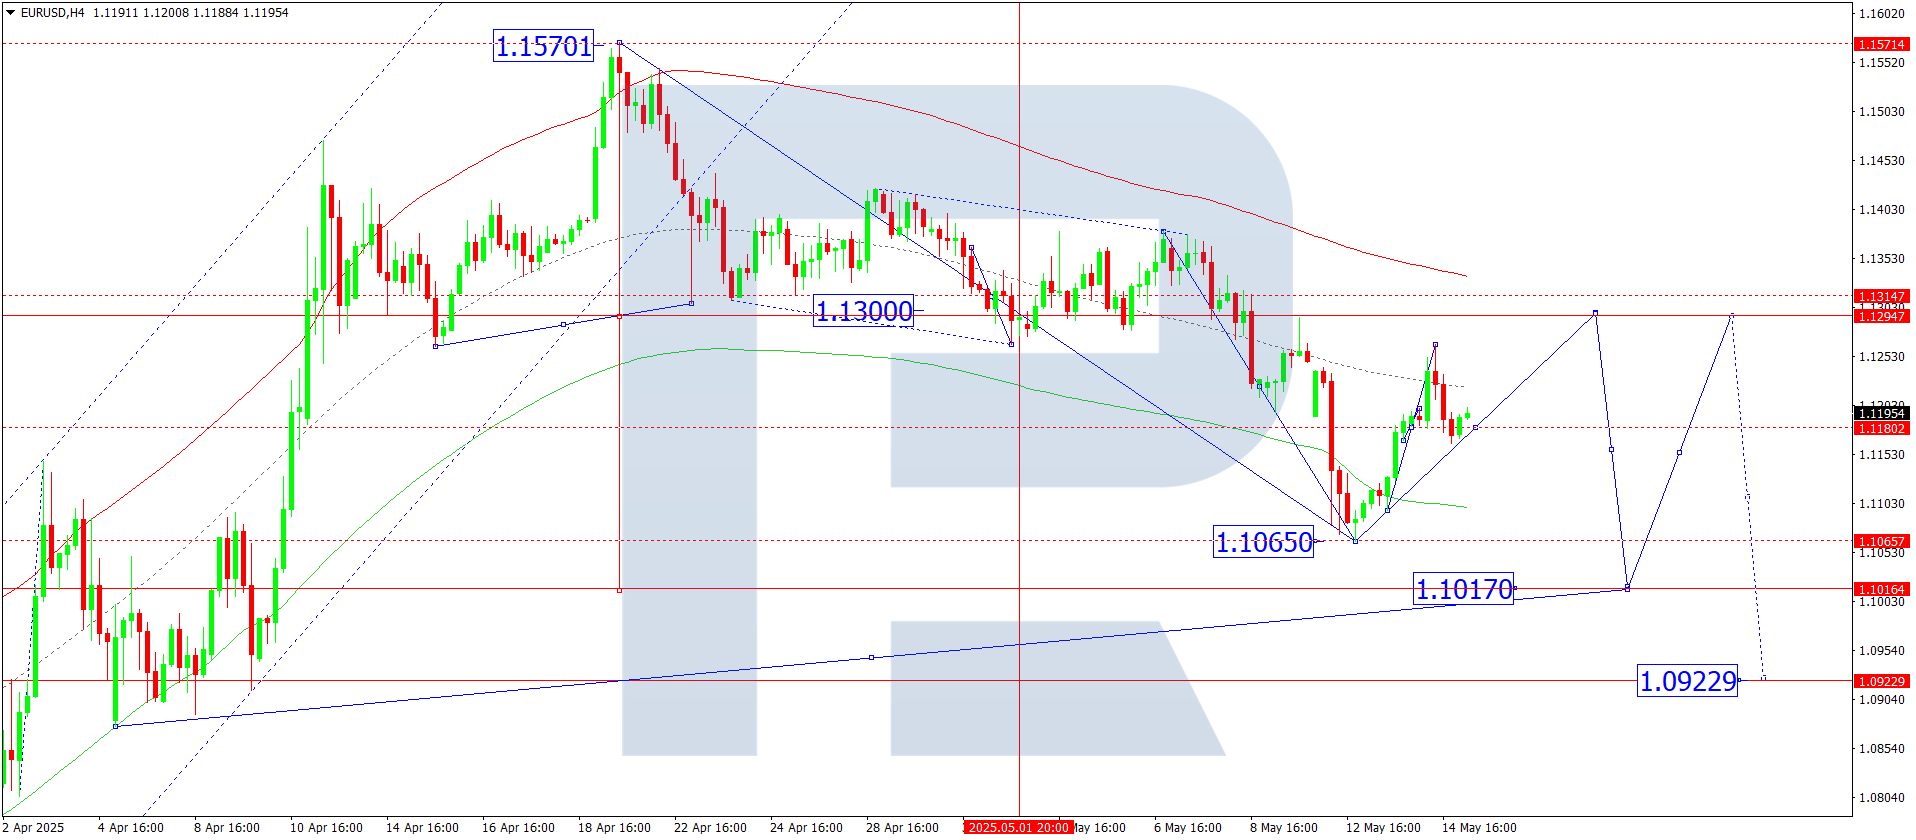
On the H4 chart of EURUSD, the market formed a consolidation range around 1.1180. At the moment, it expanded the range upwards to 1.1265 and completed a technical pullback to 1.1180 (tested from above). Today, 15 May 2025, another corrective wave towards 1.1295 is expected to develop. Afterwards, a downward wave to 1.1017 may begin.
This scenario is supported technically by the Elliott wave structure and the upward wave matrix pivoting at 1.1180, which is seen as key in this wave structure for EURUSD. Currently, the market is forming a wave towards the upper boundary of the price Envelope at 1.1295. Then, a downward wave to the central line at 1.1155 is likely. A break below this level could extend the wave further to the lower boundary at 1.1017.
Technical indicators for today’s EURUSD forecast suggest treating the current upward movement as a correction towards 1.1295.
USDJPY forecast
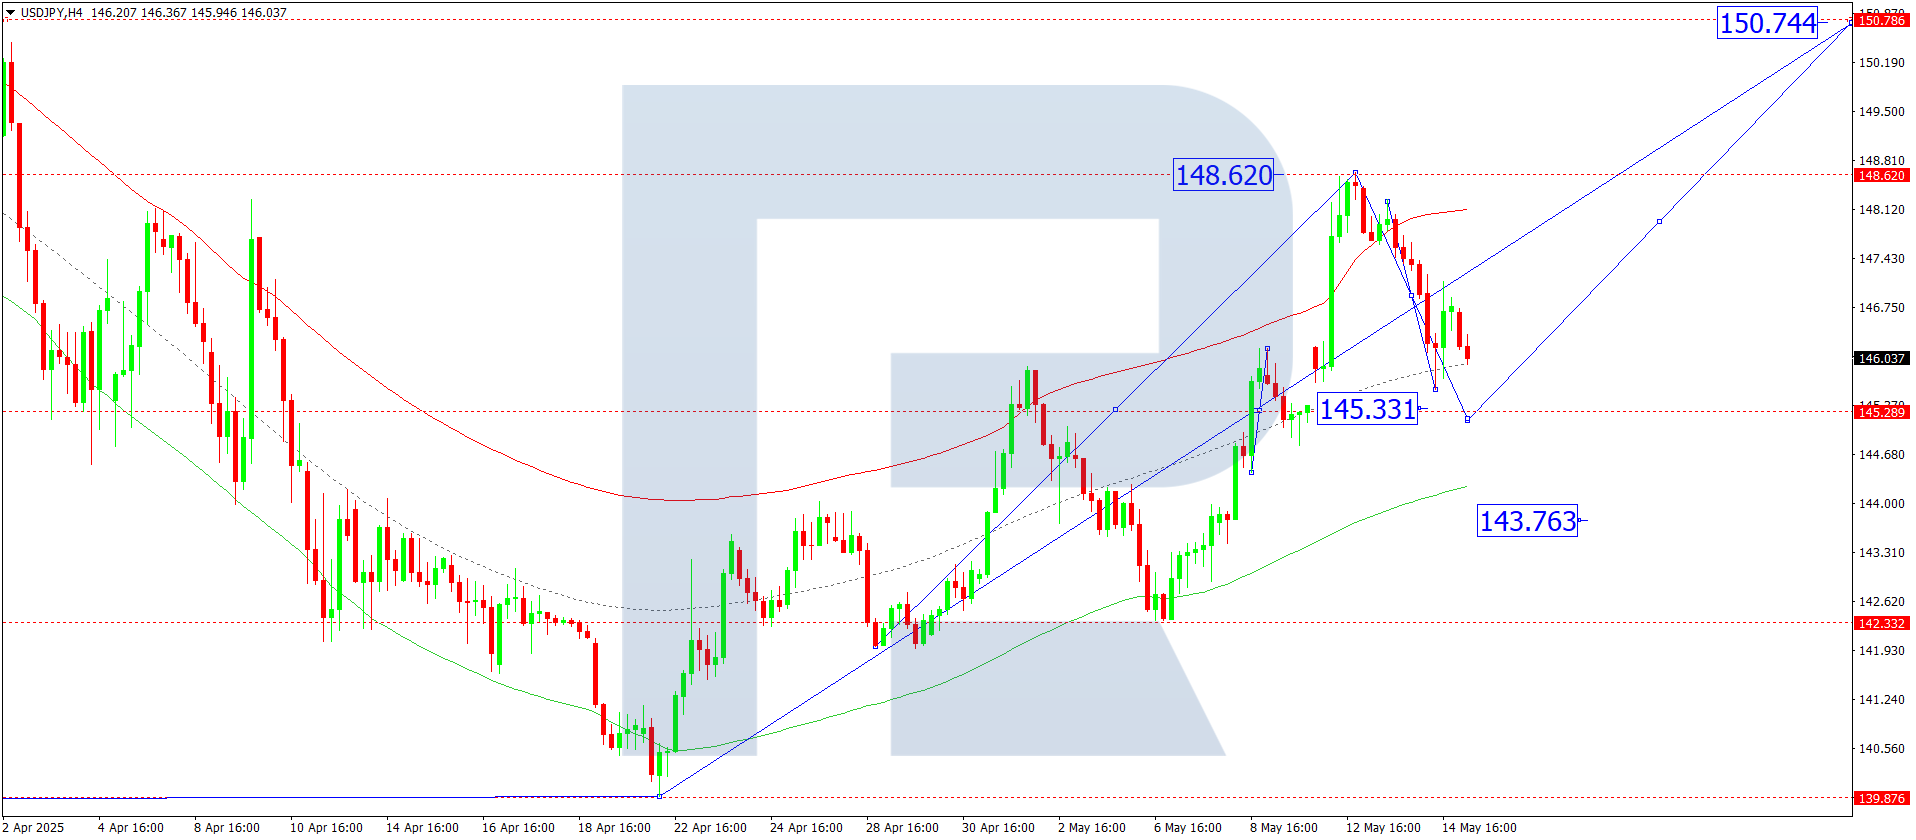
On the H4 chart of USDJPY, the market is consolidating around 146.92. It recently extended the range down to 145.60 and rebounded technically to 146.92 (tested from below). Today, 15 May 2025, a further correction to 145.33 is possible. After this correction completes, a new upward wave is expected to start, aiming for 150.77.
The scenario is confirmed by the Elliott wave structure and the upward wave matrix centred at 145.30, seen as pivotal in the current wave formation. The market has completed the third upward wave to the upper boundary of the price Envelope at 148.64. A correction to the lower boundary at 145.33 remains possible before a new upward wave to 150.77.
Technical indicators for today’s USDJPY forecast suggest a correction to 145.33.
GBPUSD forecast
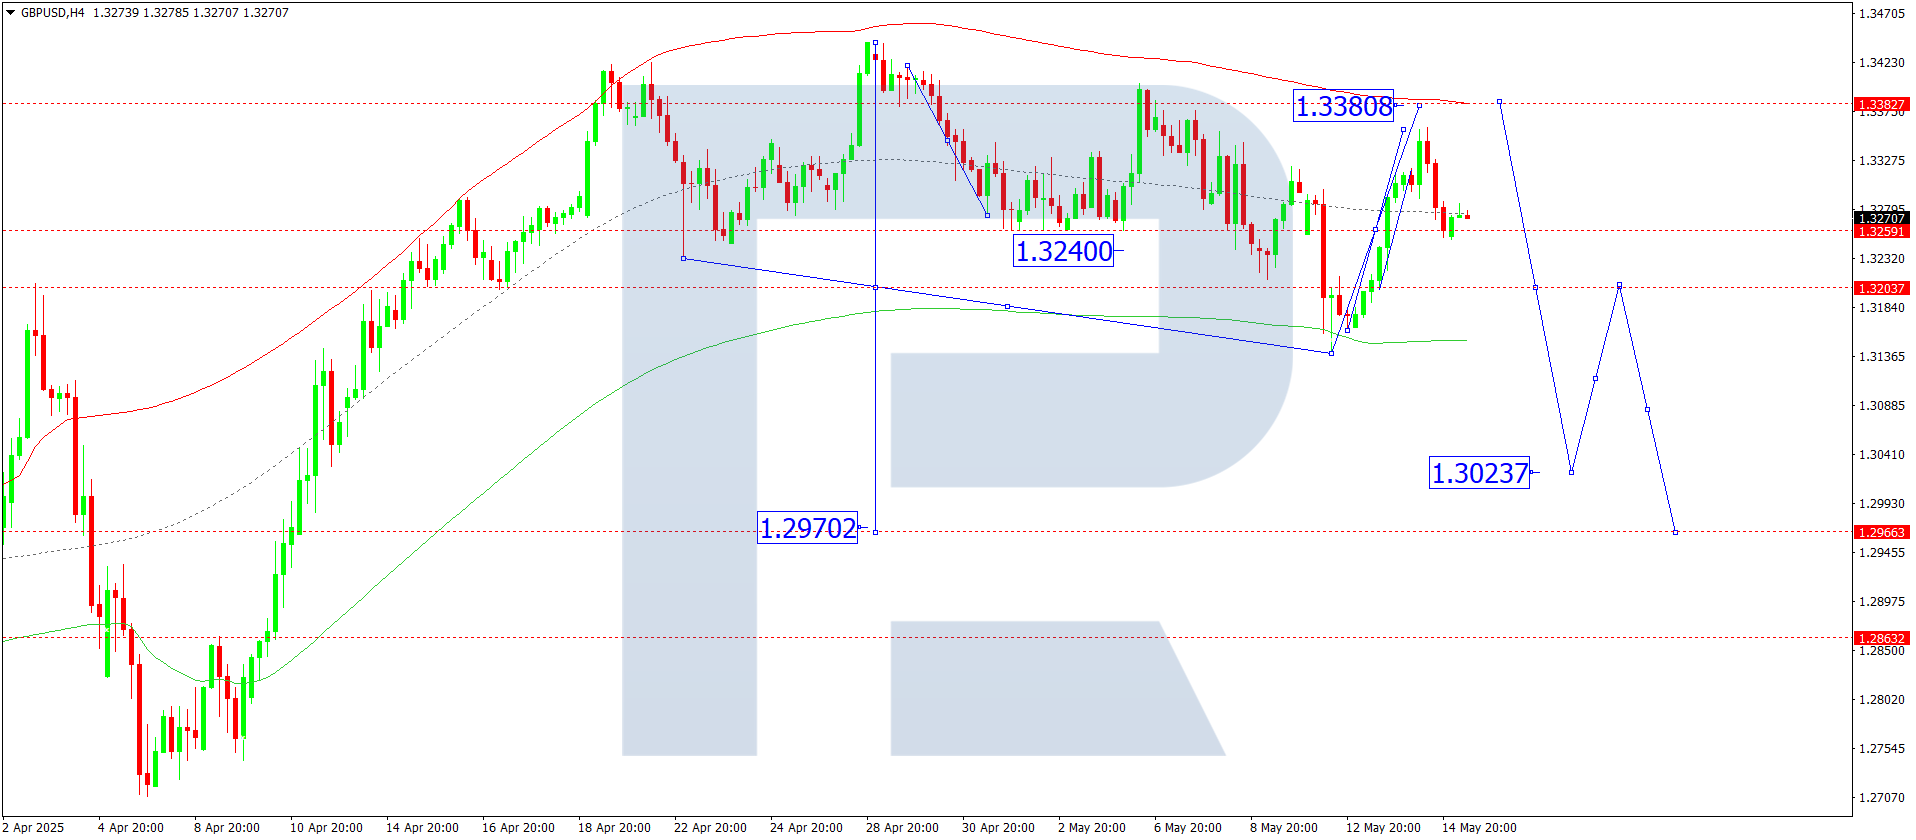
On the H4 chart of GBPUSD, the market consolidated around 1.3260. The range was extended upwards to 1.3360, followed by a technical pullback to 1.3260 (tested from above). Today, 15 May 2025, this correction could end at 1.3380. Afterwards, a new downward wave to 1.3030 is possible.
This scenario for GBPUSD aligns with the Elliott wave structure and the downward wave matrix, with the pivot level at 1.3380 viewed as key. The market has previously completed a downward wave to the lower boundary of the price Envelope at 1.3141. A correction towards the upper boundary at 1.3380 remains possible.
Technical indicators for today’s GBPUSD forecast suggest viewing the rise as a correction towards 1.3380.
AUDUSD forecast
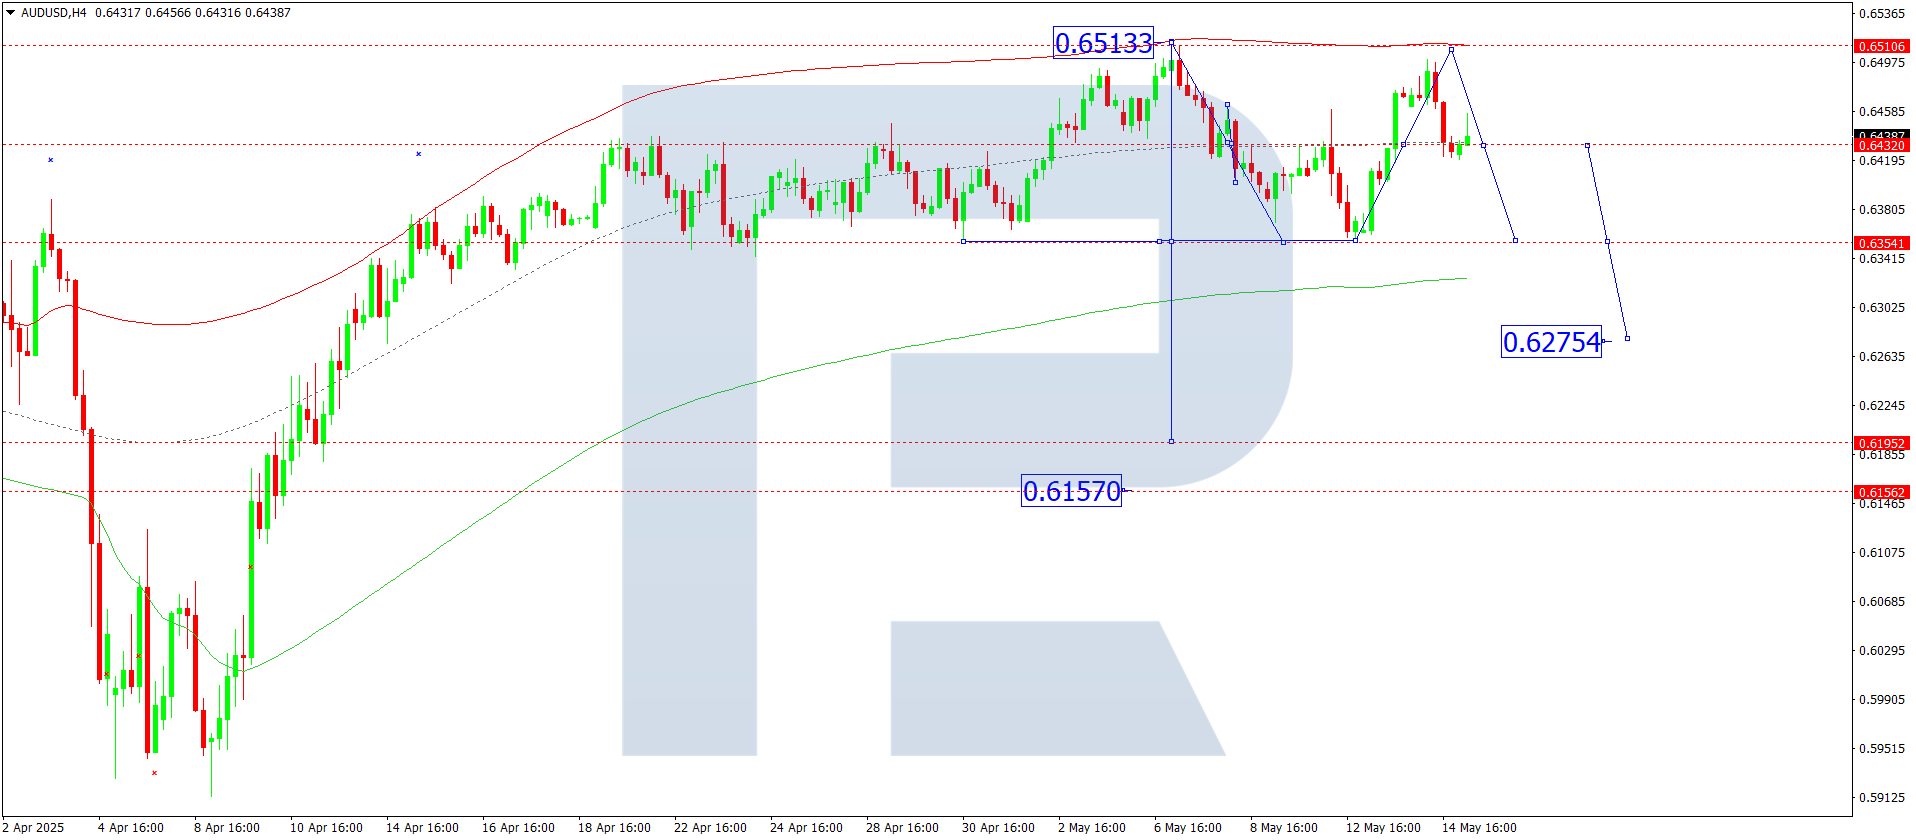
On the H4 chart of AUDUSD, the market continues to form a broad consolidation range around 0.6434. Today, 15 May 2025, the range could expand upwards to 0.6510. Afterwards, a decline towards 0.6355 could follow. A breakout below this level would open the way for a further downward wave to 0.6200, the first target.
This scenario aligns with the Elliott wave structure and the downward wave matrix for AUDUSD, with the pivot level at 0.6434, seen as crucial in this wave structure. The current structure is moving towards the upper boundary of the price Envelope at 0.6510. Then, a correction to the central line at 0.6355 is possible.
Technical indicators for today’s AUDUSD forecast support the likelihood of a downward wave to 0.6355.
USDCAD forecast
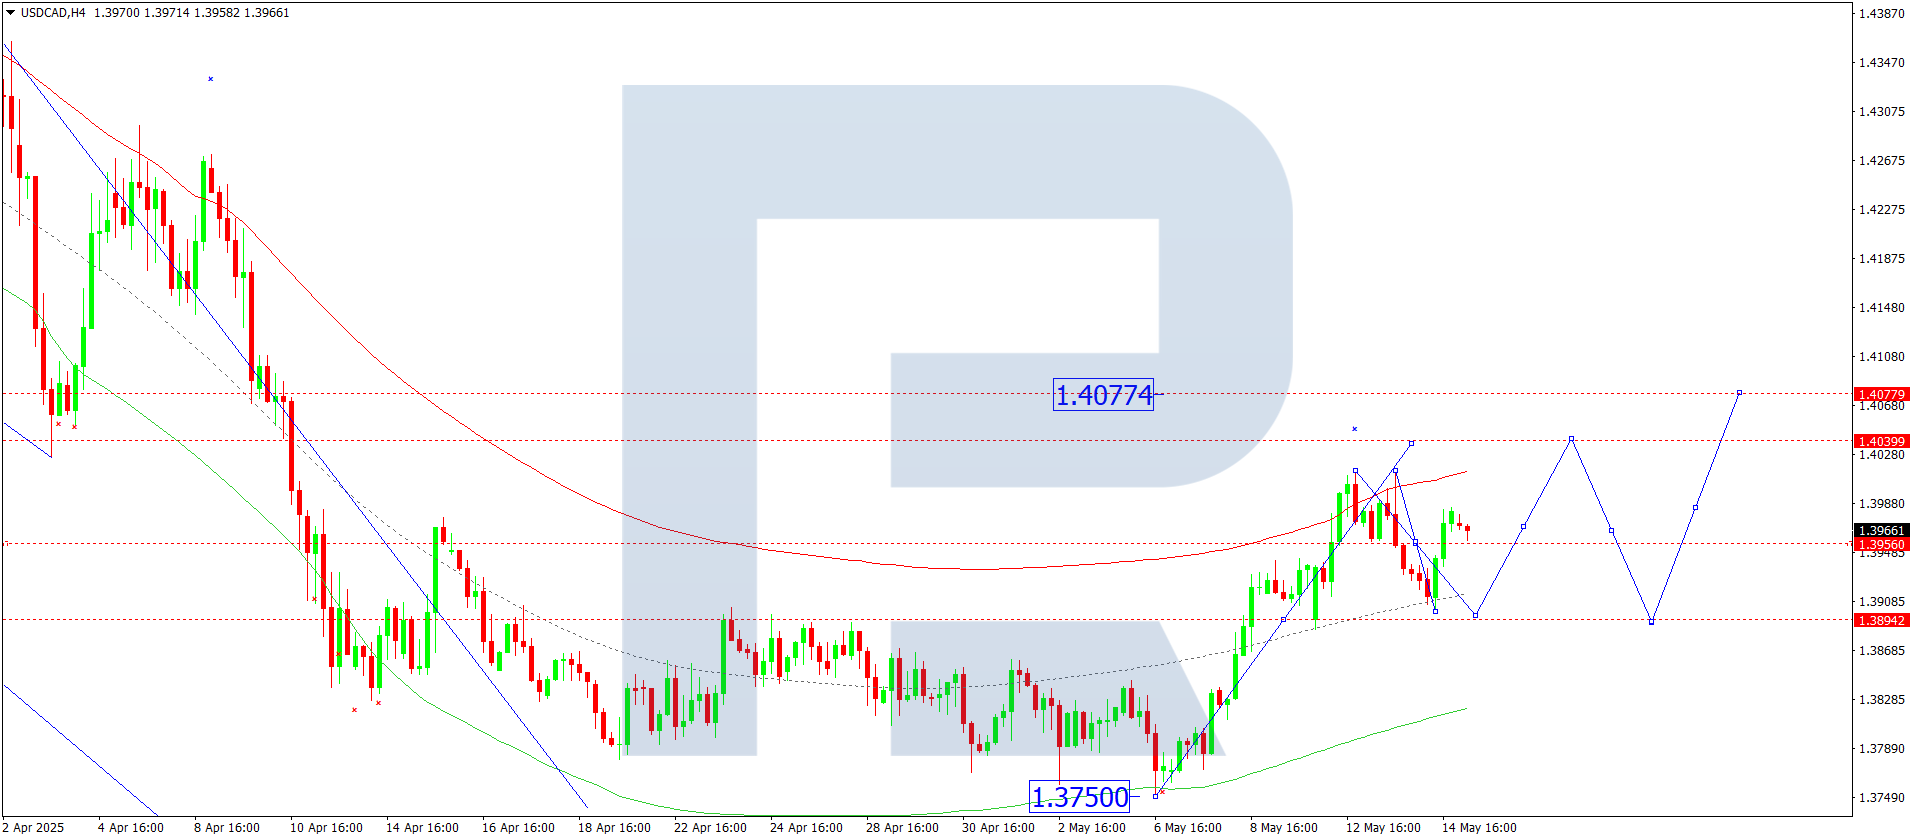
On the H4 chart of USDCAD, the market formed a consolidation range around 1.3956. The range was extended downwards to 1.3900, followed by a technical rebound to 1.3980 (tested from below). Today, 15 May 2025, this downward wave is expected to end at 1.3894, followed by a new upward wave towards 1.4040.
This scenario is supported by the Elliott wave structure and the upward wave matrix with a pivot at 1.3890, which is seen as key in this wave formation for USDCAD. The market previously reached the upper boundary of the price Envelope at 1.4012. A correction to the central line at 1.3894 is now likely.
Technical indicators for today’s USDCAD forecast suggest a corrective downward wave to 1.3894.
XAUUSD forecast
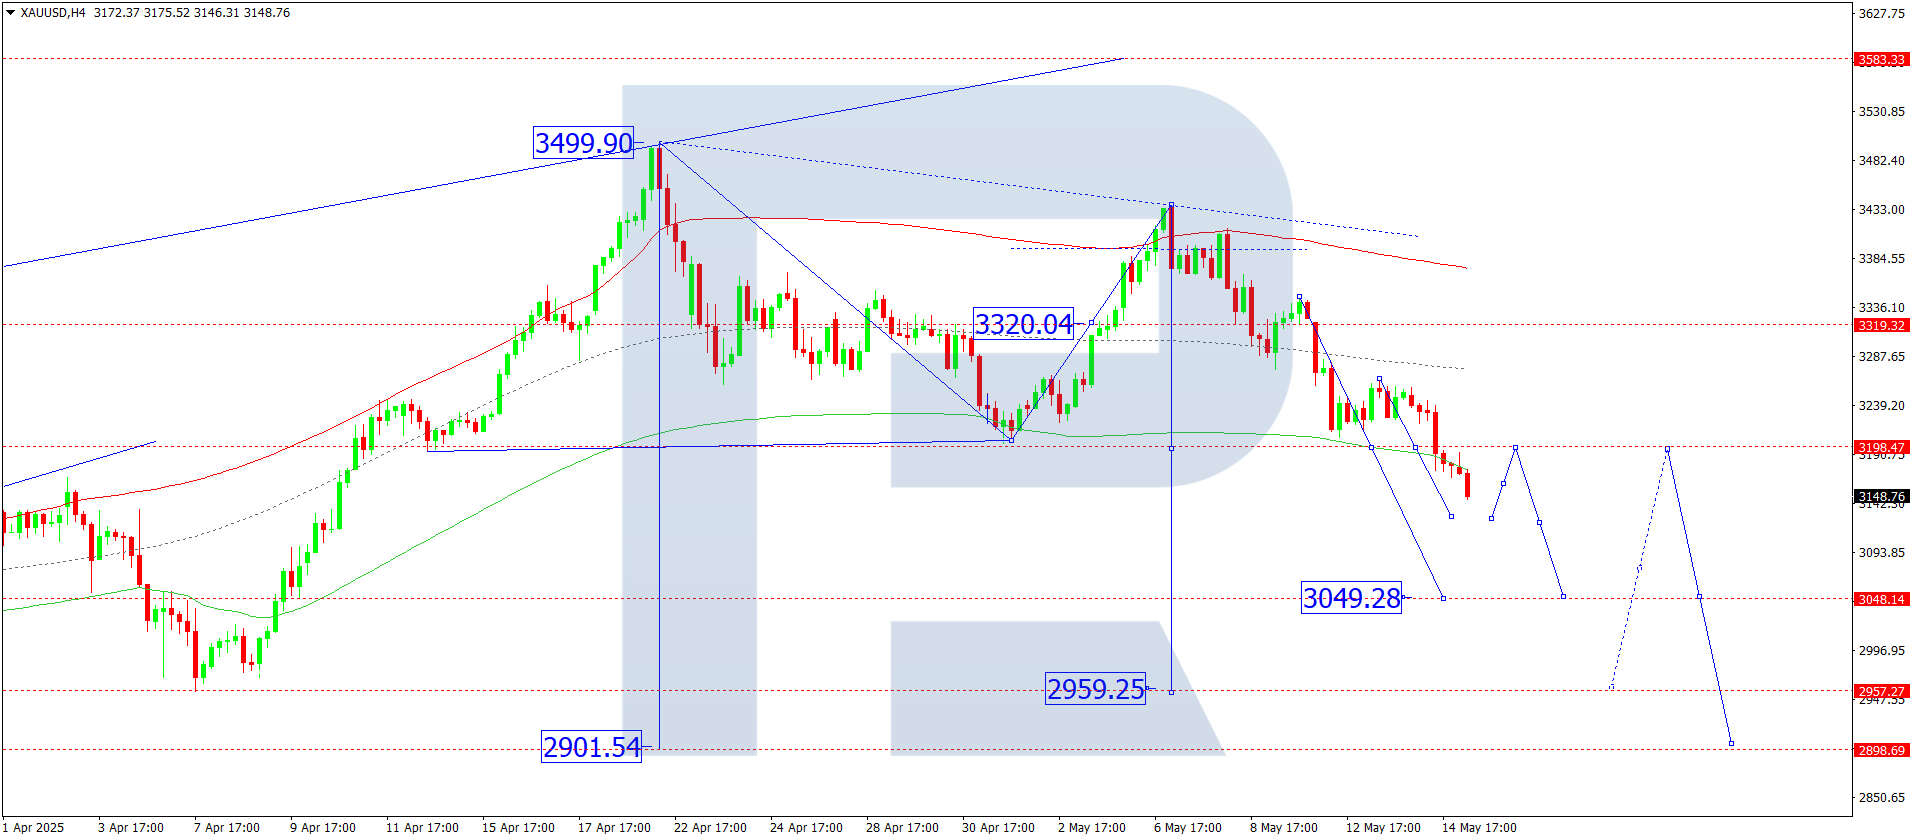
On the H4 chart of XAUUSD, the market broke below 3,198 and continues to develop the third wave of decline towards 3,050, with a potential extension to 2,960, a local target. Today, 15 May 2025, a drop to 3,125 is expected, followed by a rise to 3,198 (tested from below). Then, a new downward wave to 3,050 may begin.
This scenario is confirmed by the Elliott wave structure and the downward wave matrix, pivoting at 3,200, seen as key in this wave for XAUUSD. The market is currently shaping a wave towards the lower boundary of the price Envelope at 3,050. Afterwards, a corrective upward wave to the central line at 3,200 may form.
Technical indicators for today’s XAUUSD forecast point to a possible downward wave to 3,050.
Brent forecast
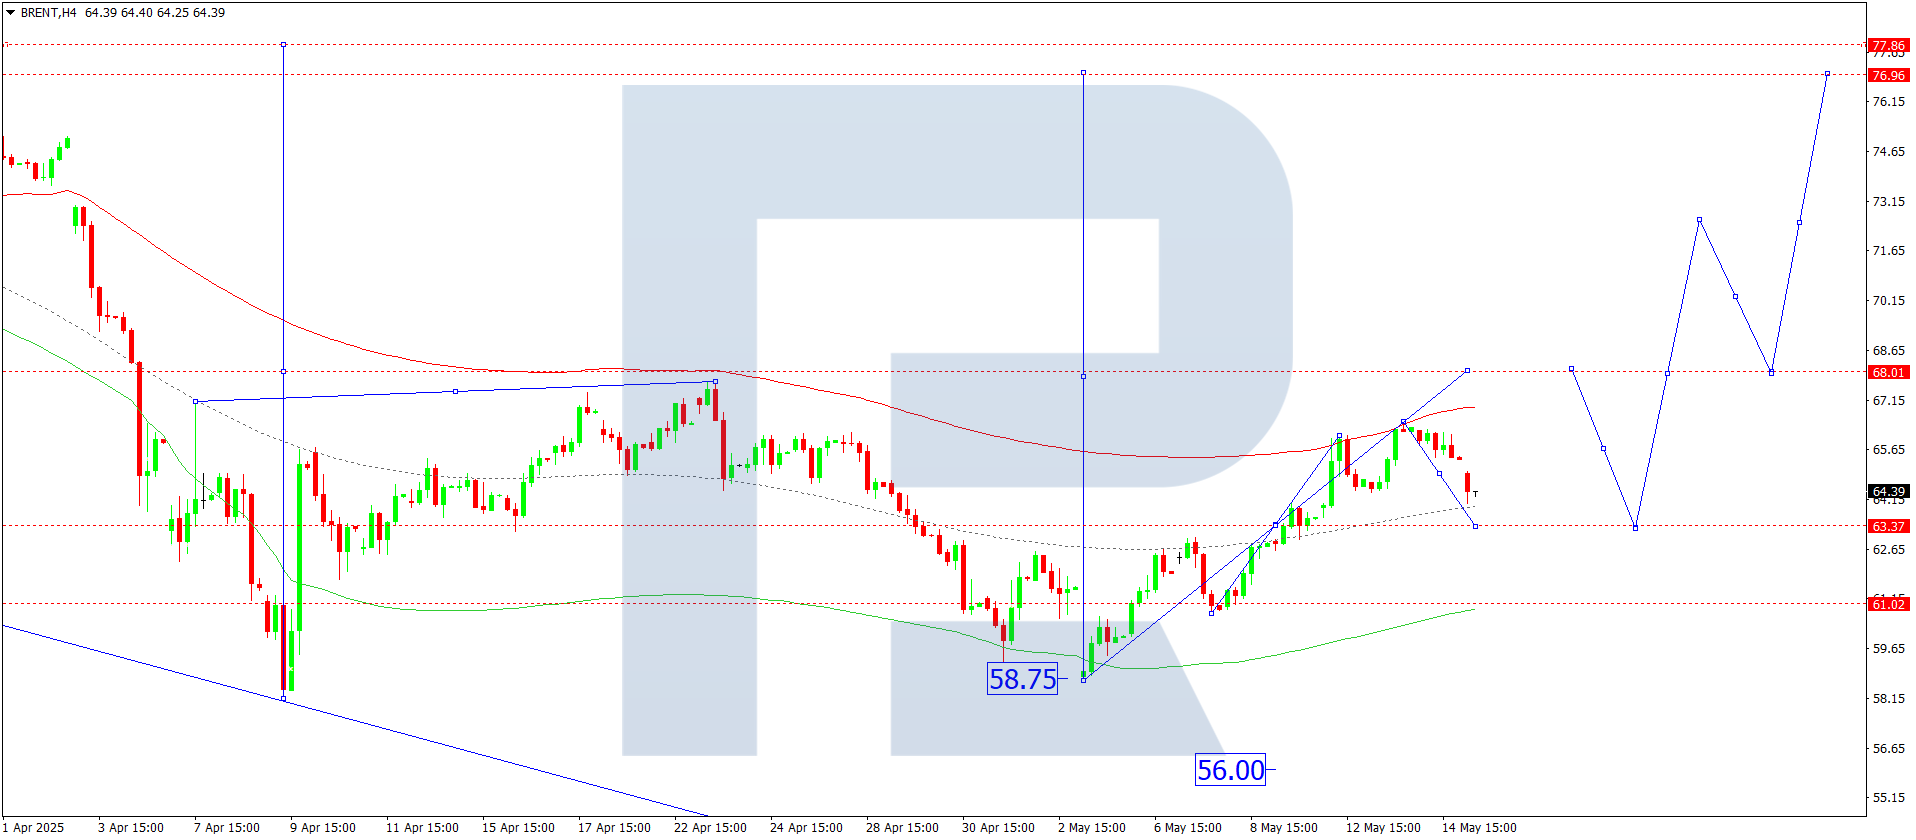
On the H4 Brent crude chart, the market continues its correction towards 63.33. Today, 15 May 2025, the current corrective structure is expected to end at 63.33 (tested from above). Afterwards, a new upward wave to 68.22 may begin. A breakout above this level would open the potential for an extended upward wave to 73.20, the local target.
This scenario is technically confirmed by the Elliott wave structure and the upward wave matrix with a pivot at 63.33, regarded as key in this Brent wave formation. The market previously reached the upper boundary of the price Envelope at 66.40. A correction to the central line at 63.33 is expected.
Technical indicators in today’s Brent forecast suggest a continued corrective wave to 63.33.


