Here is a detailed daily technical analysis and forecast for EURUSD, USDJPY, GBPUSD, AUDUSD, USDCAD, XAUUSD and Brent for 17 September 2025.
EURUSD forecast
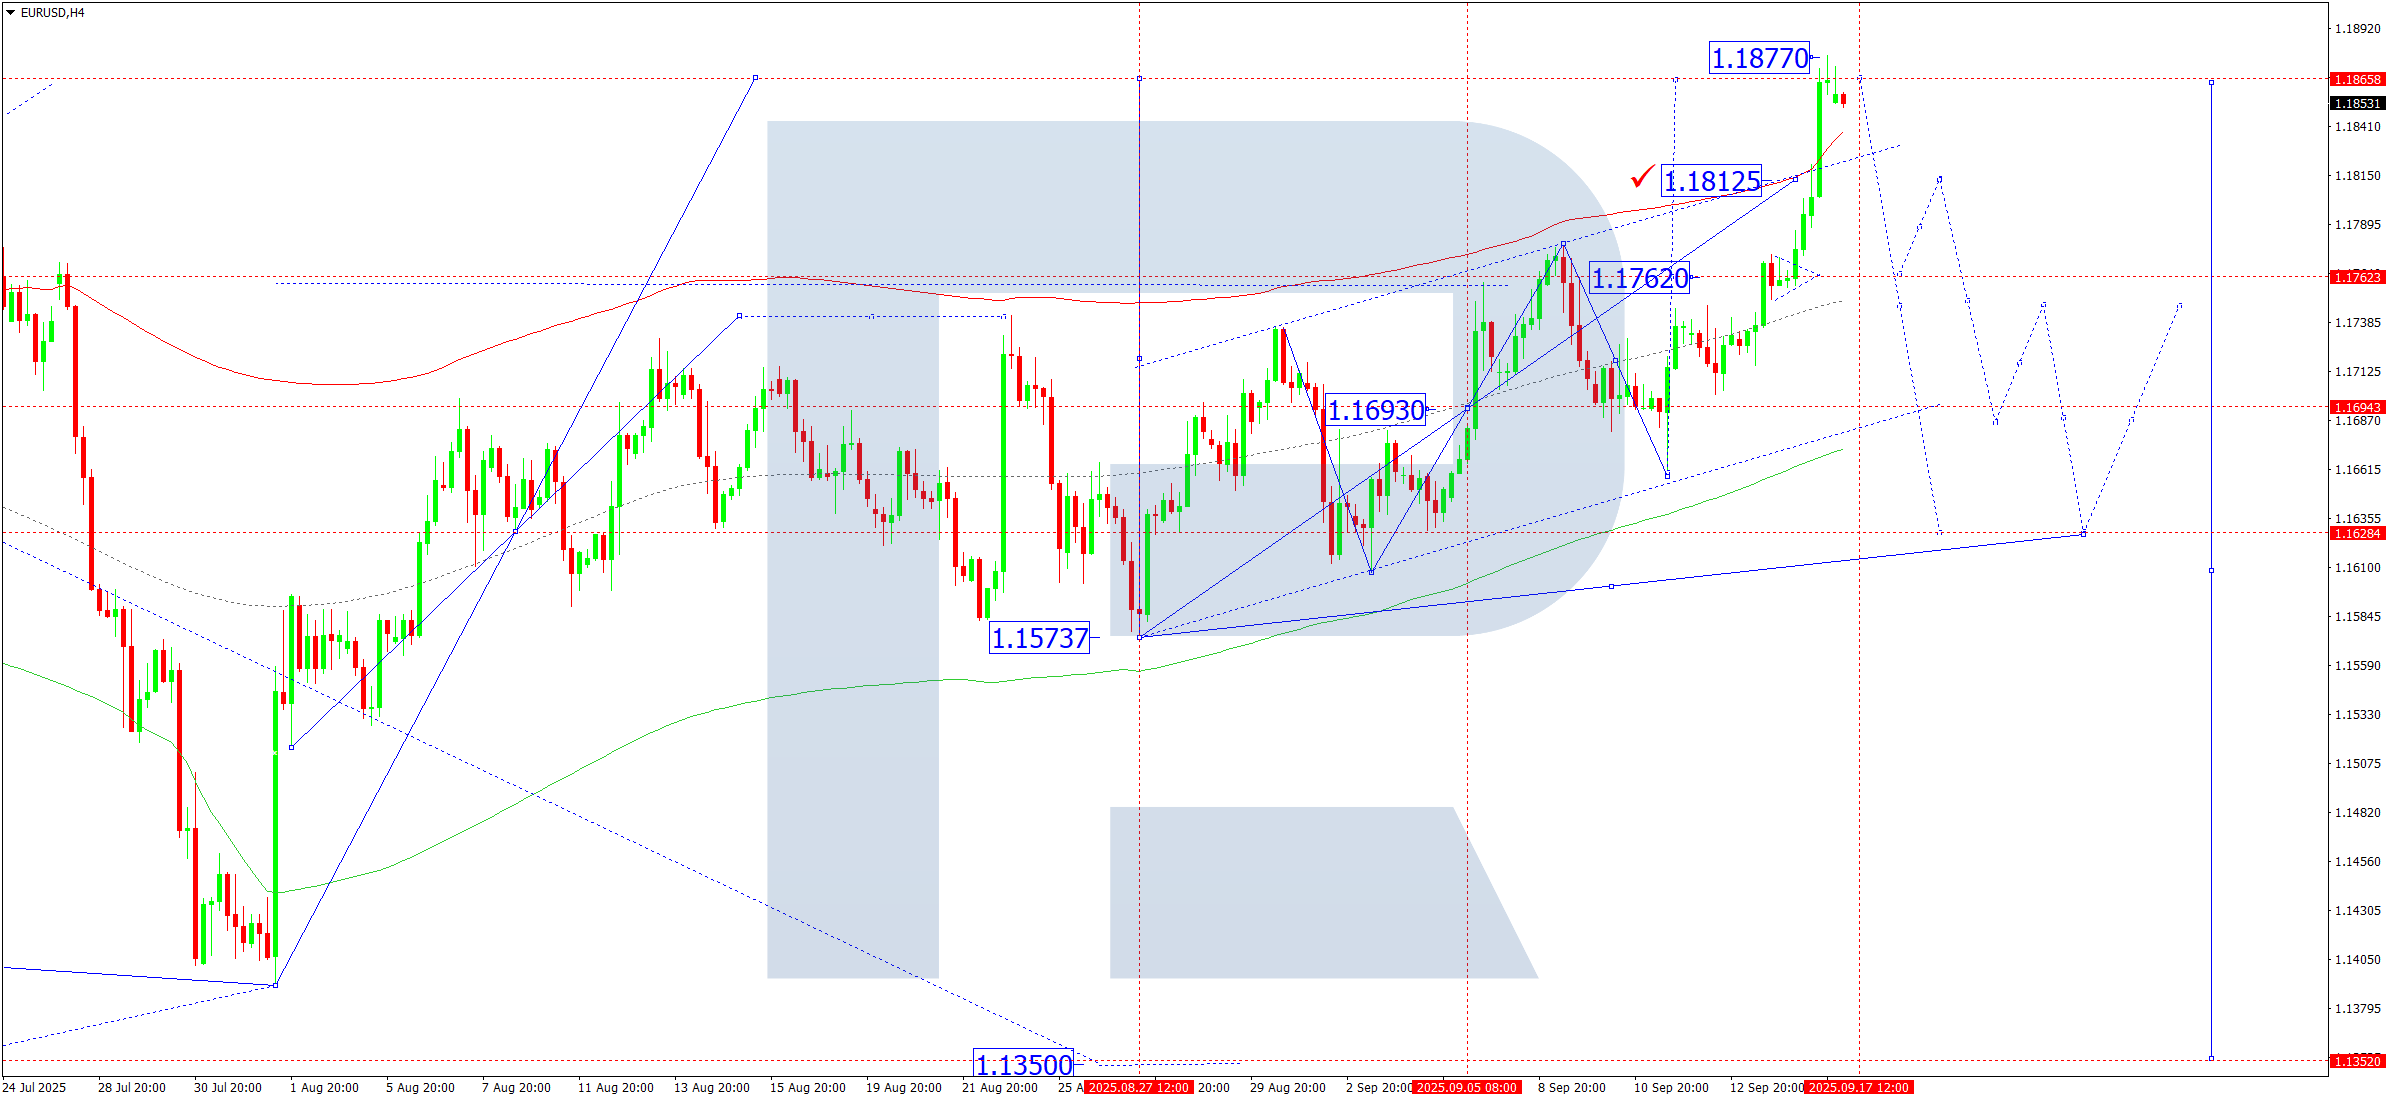
On the H4 chart of EURUSD, the market broke above 1.1766 and extended the growth wave to 1.1877. Today, 17 September 2025, a correction to 1.1766 (testing from above) is expected. Afterwards, a growth swing to 1.1812 may follow, forming a consolidation range around this level. A downward breakout would open potential for a new decline to 1.1630, the first target.
Technically, the Elliott wave structure and the growth wave matrix with a pivot at 1.1630 confirm this scenario for EURUSD. At the moment, the market completed a growth wave to the upper boundary of the Price Envelope at 1.1877. A decline towards its central line at 1.1766 is expected.
Technical indicators for today’s EURUSD forecast suggest a downward wave towards 1.1766.

USDJPY forecast
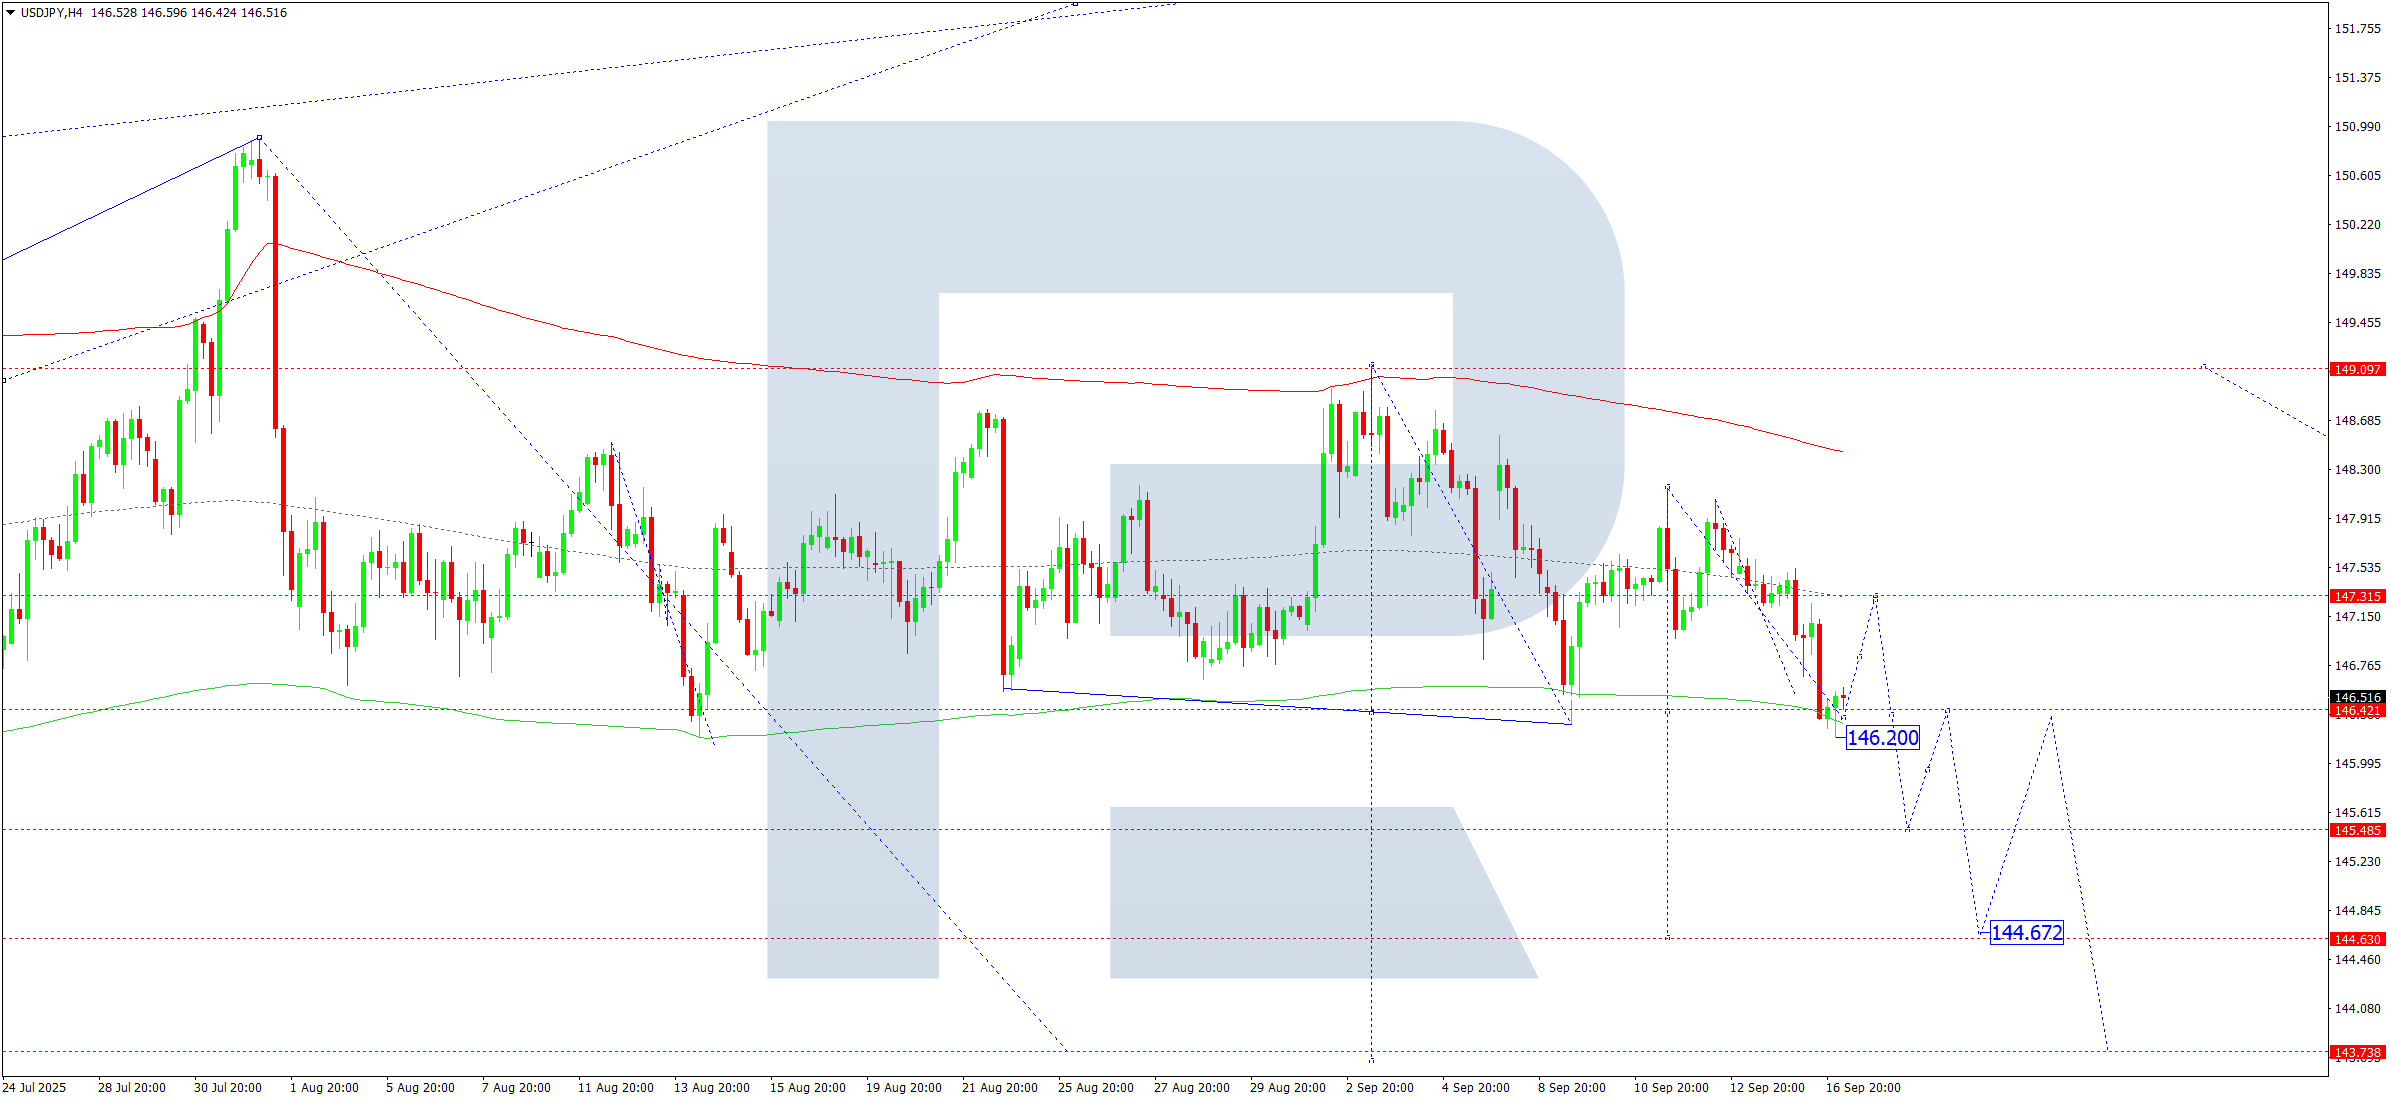
On the H4 chart of USDJPY, the market completed a decline to 146.20. Today, 17 September 2025, a correction to 147.30 is expected. The market continues to form a broad consolidation range around 147.30. A downward breakout would open potential for a further decline to 146.11 with continuation to 145.50.
Technically, the Elliott wave structure and the downward wave matrix with a pivot at 147.30 confirm this scenario for USDJPY. At the moment, the market has completed a decline to the lower boundary of the Price Envelope at 146.20. A correction towards its central line at 147.30 is relevant today.
Technical indicators for today’s USDJPY forecast suggest a growth move to 147.30.
GBPUSD forecast
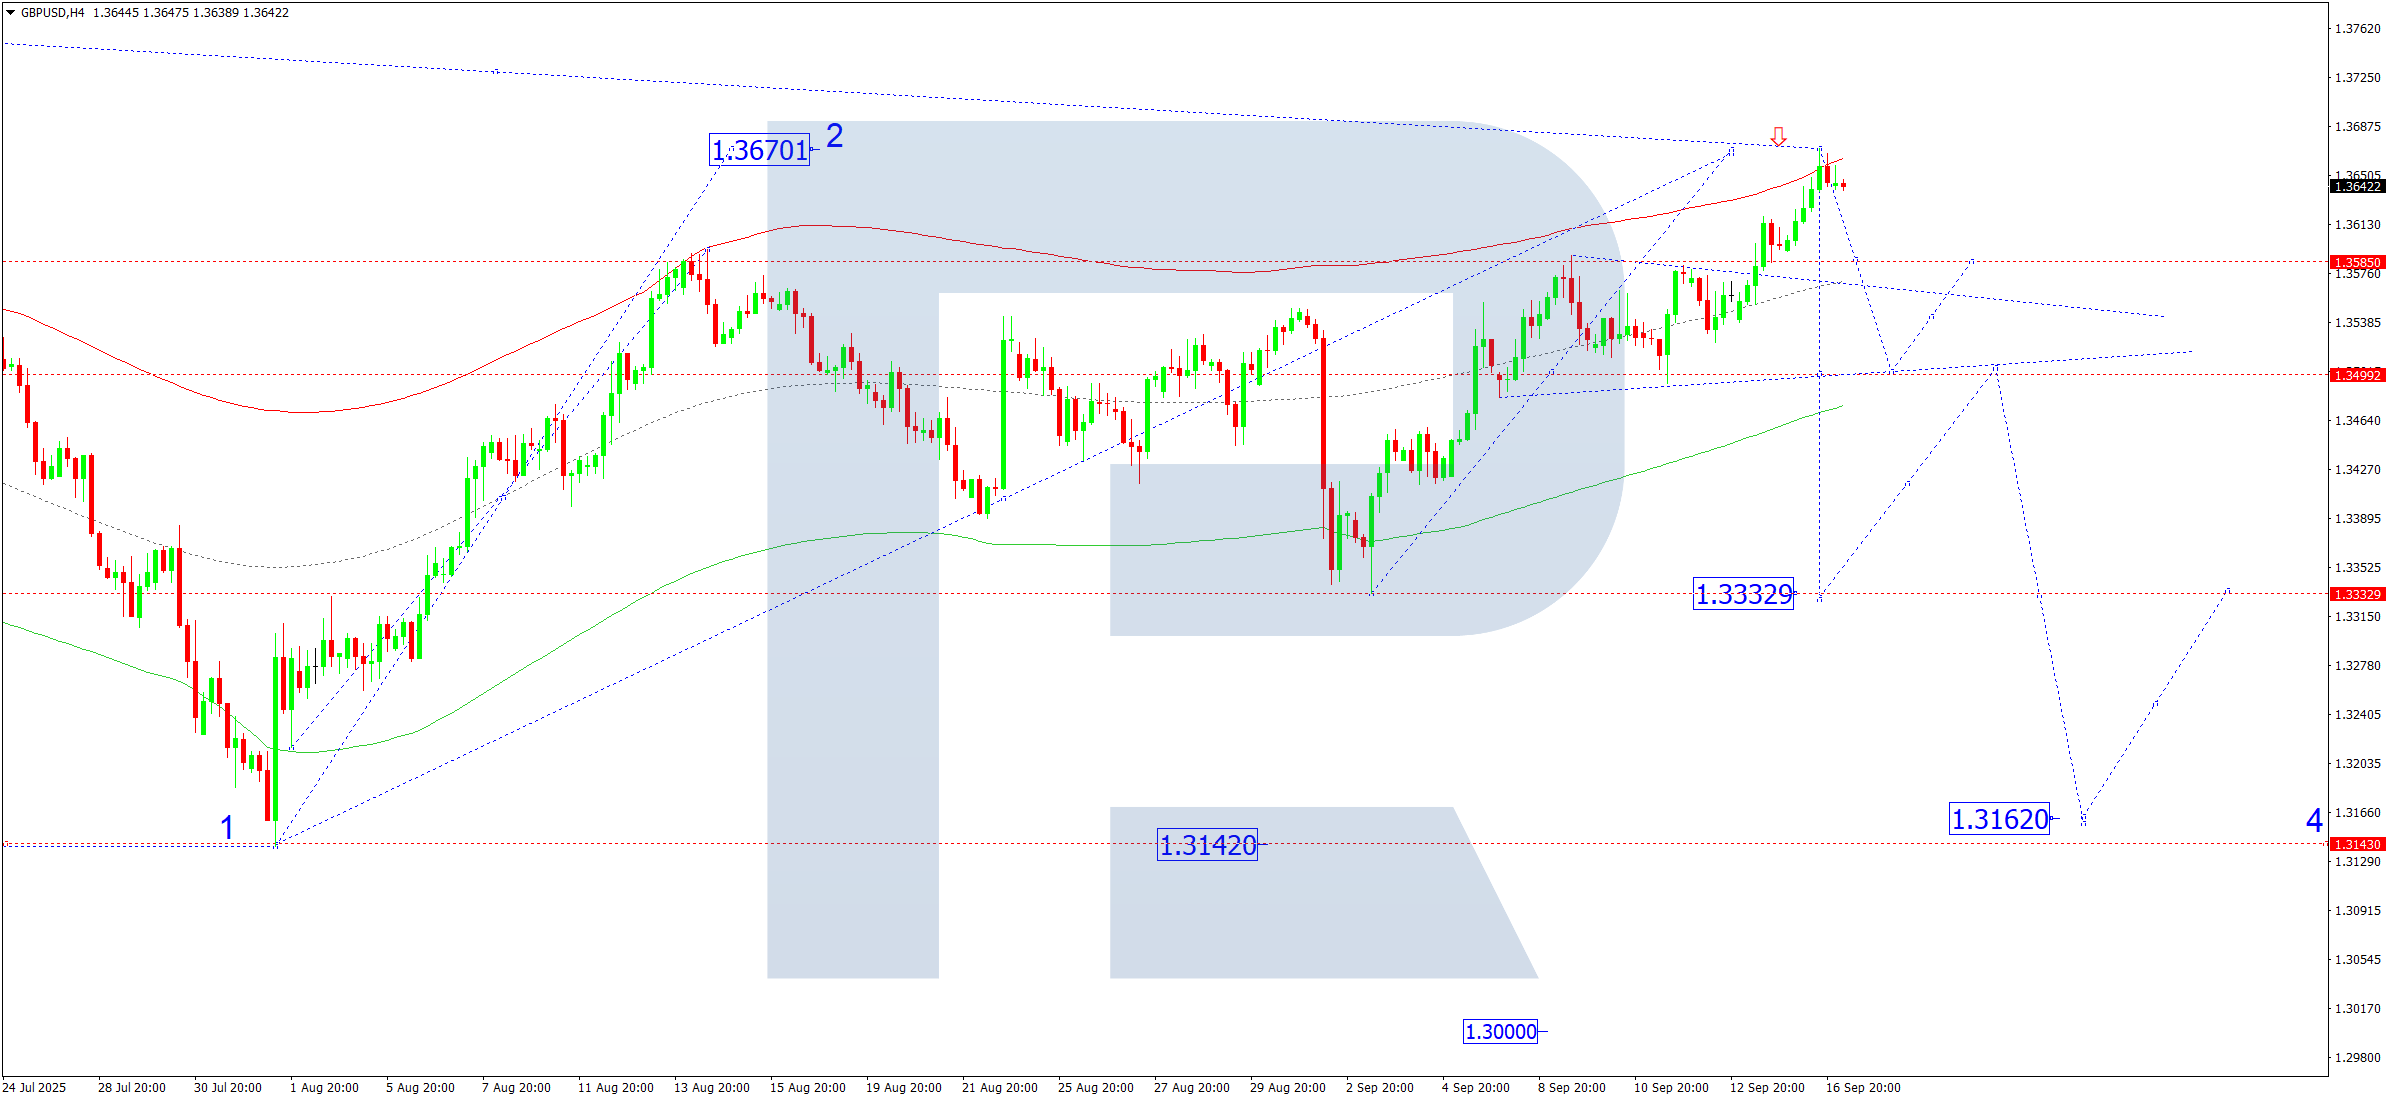
On the H4 chart of GBPUSD, the market completed a growth wave to 1.3670. Today, 17 September 2025, a new decline to 1.3500 is expected, followed by growth to 1.3580.
Technically, the Elliott wave structure and the growth wave matrix with a pivot at 1.3400 confirm this scenario for GBPUSD. At the moment, the market reached the upper boundary of the Price Envelope at 1.3670. A new downward wave to 1.3500 is relevant today.
Technical indicators for today’s GBPUSD forecast suggest a downward move to 1.3500.
AUDUSD forecast
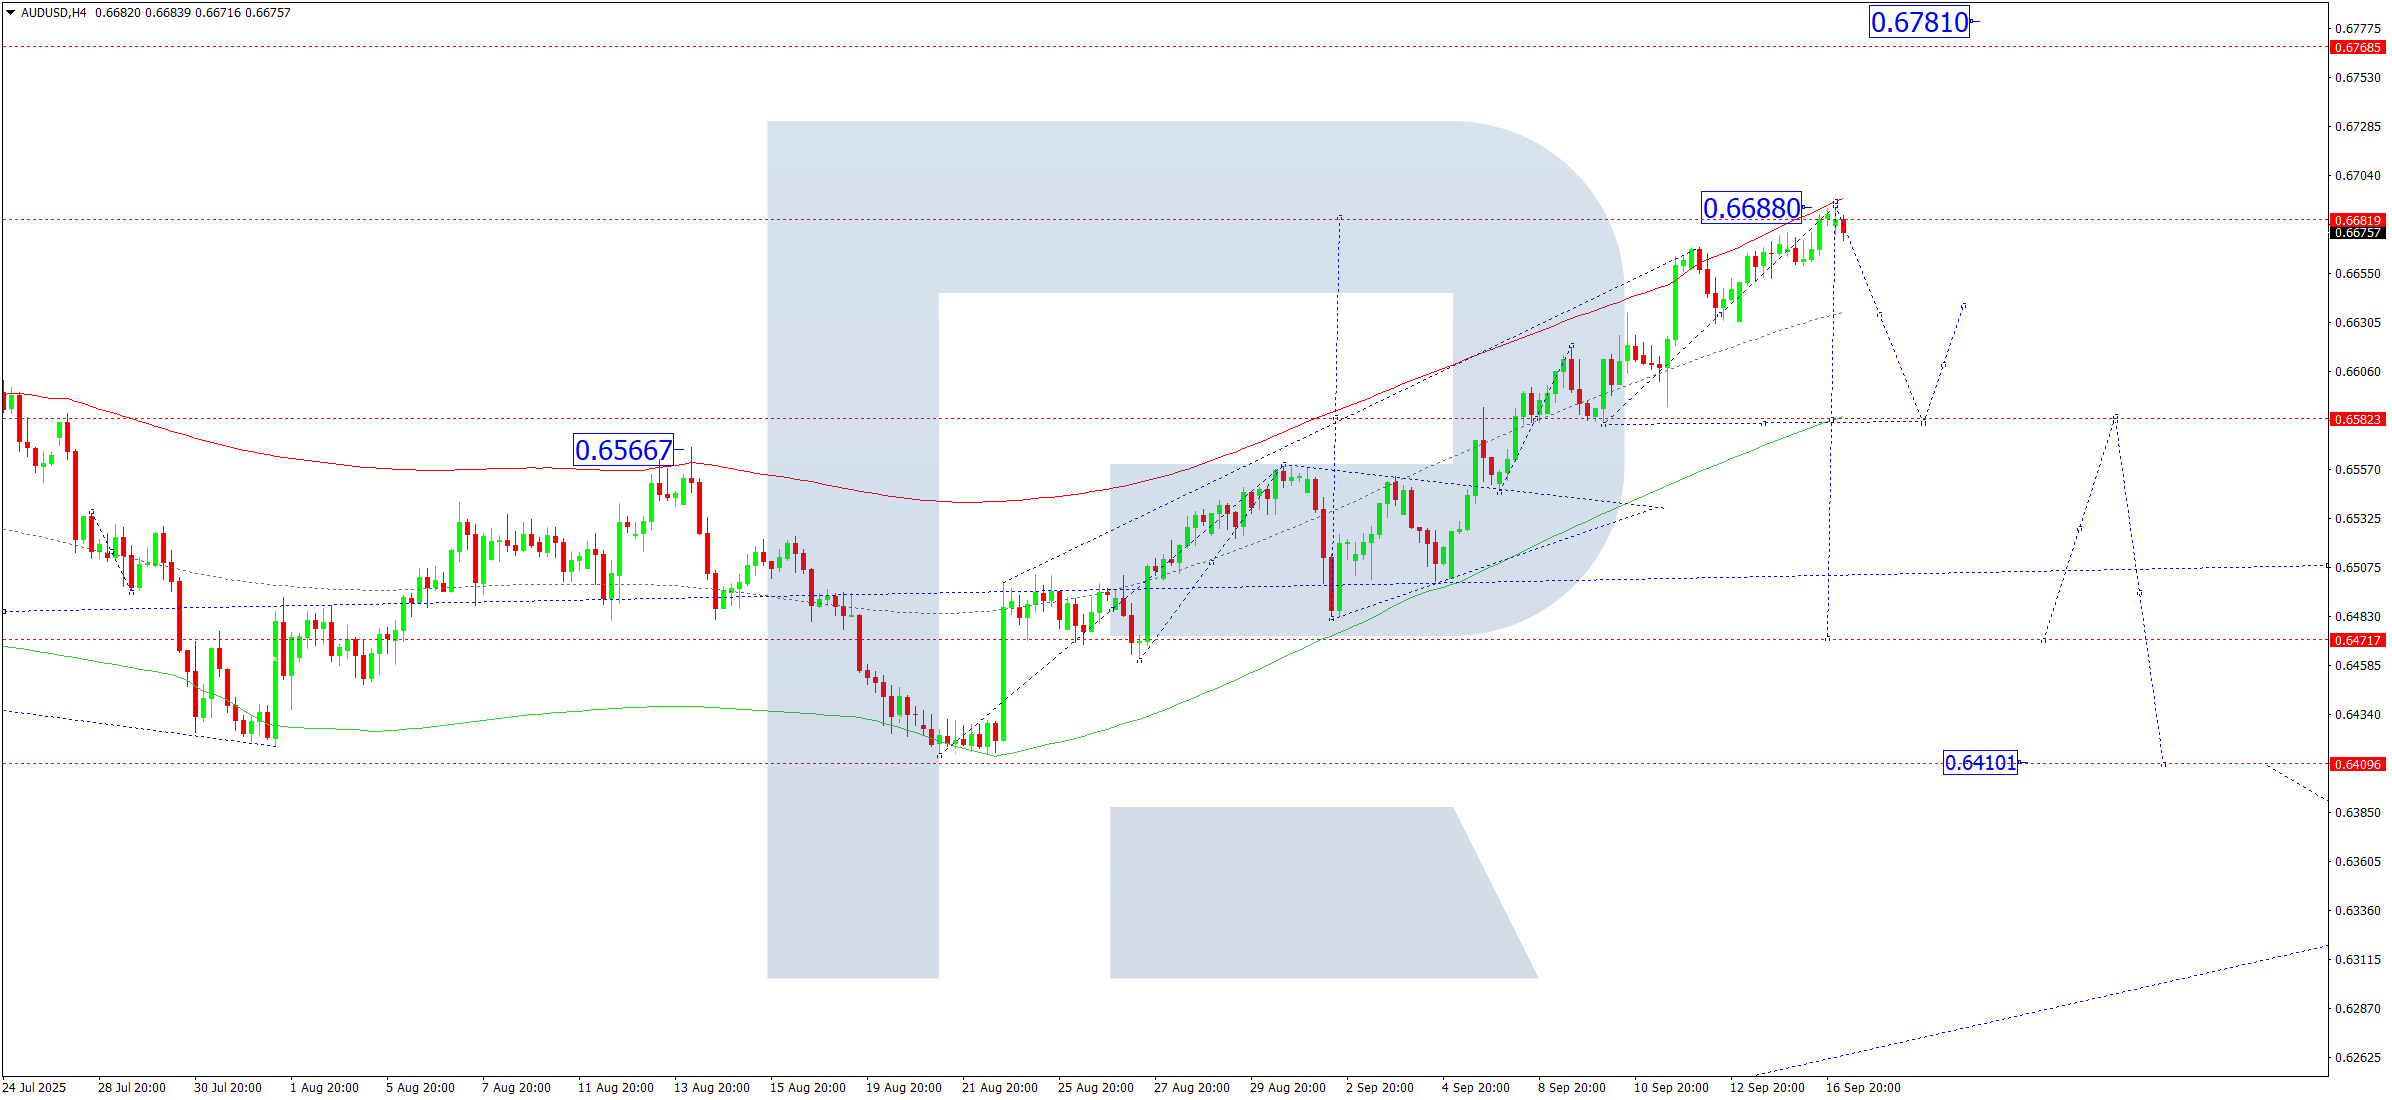
On the H4 chart of AUDUSD, the market completed a growth wave to 0.6688. Today, 17 September 2025, a decline to 0.6580 is expected, followed by growth to 0.6640.
Technically, the Elliott wave structure and the growth wave matrix with a pivot at 0.6511 confirm this scenario for AUDUSD. At the moment, the market reached the upper boundary of the Price Envelope at 0.6688. A decline towards its lower boundary at 0.6580 is possible today.
Technical indicators for today’s AUDUSD forecast suggest a downward wave to 0.6580.
USDCAD forecast
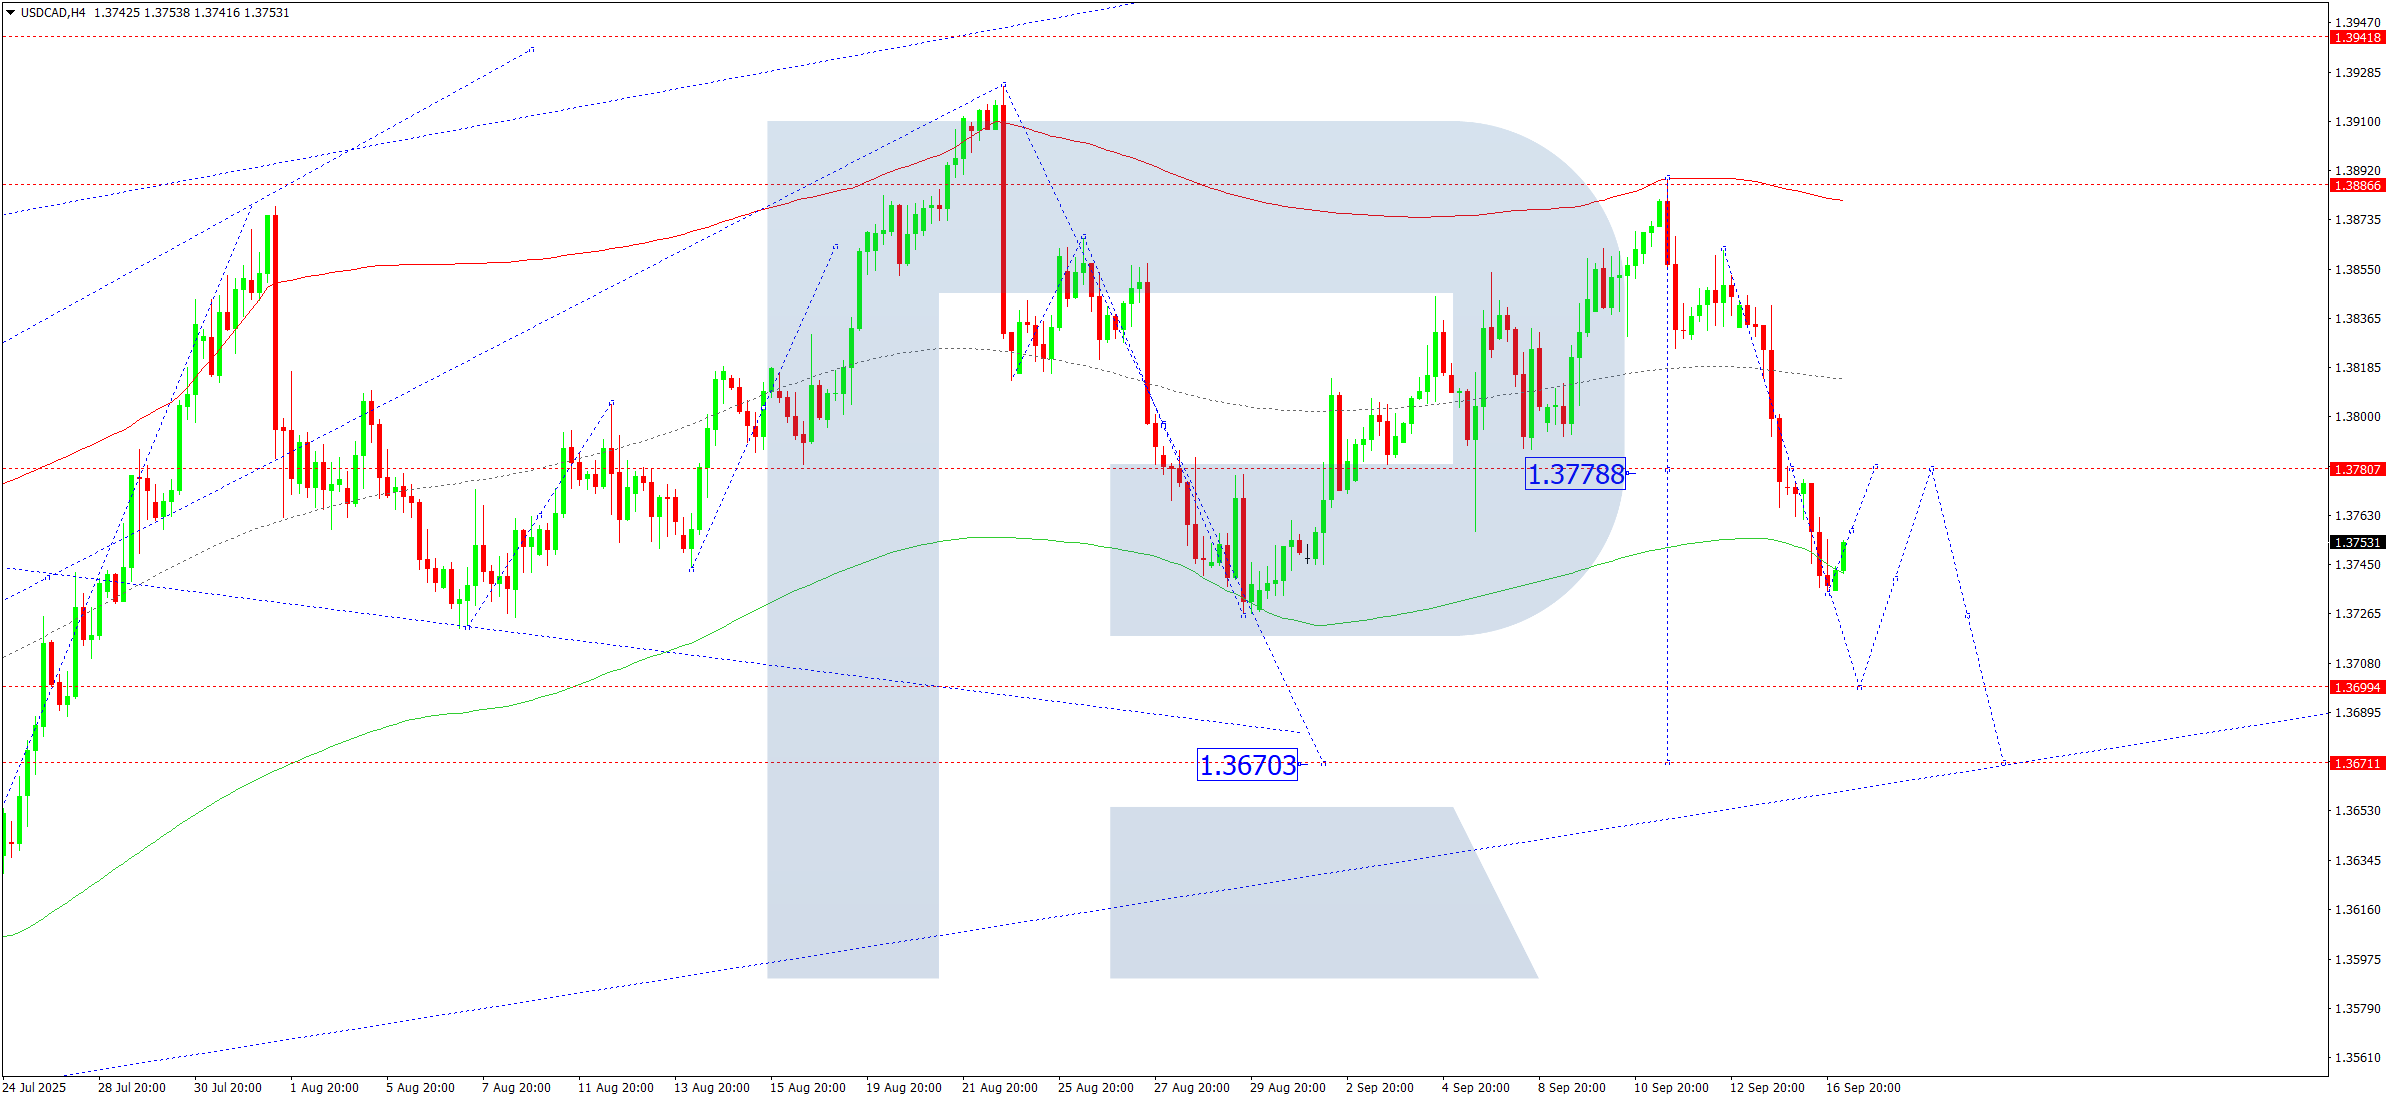
On the H4 chart of USDCAD, the market completed a decline to 1.3734. Today, 17 September 2025, a correction to 1.3778 is possible, followed by a further decline to 1.3700.
Technically, the Elliott wave structure and the downward wave matrix with a pivot at 1.3800 confirm this scenario for USDCAD. At the moment, the market continues to form a decline towards the lower boundary of the Price Envelope at 1.3700. A correction towards its central line at 1.3778 (testing from below) may occur, before another decline to its lower boundary at 1.3670.
Technical indicators for today’s USDCAD forecast suggest a correction towards 1.3778.
XAUUSD forecast
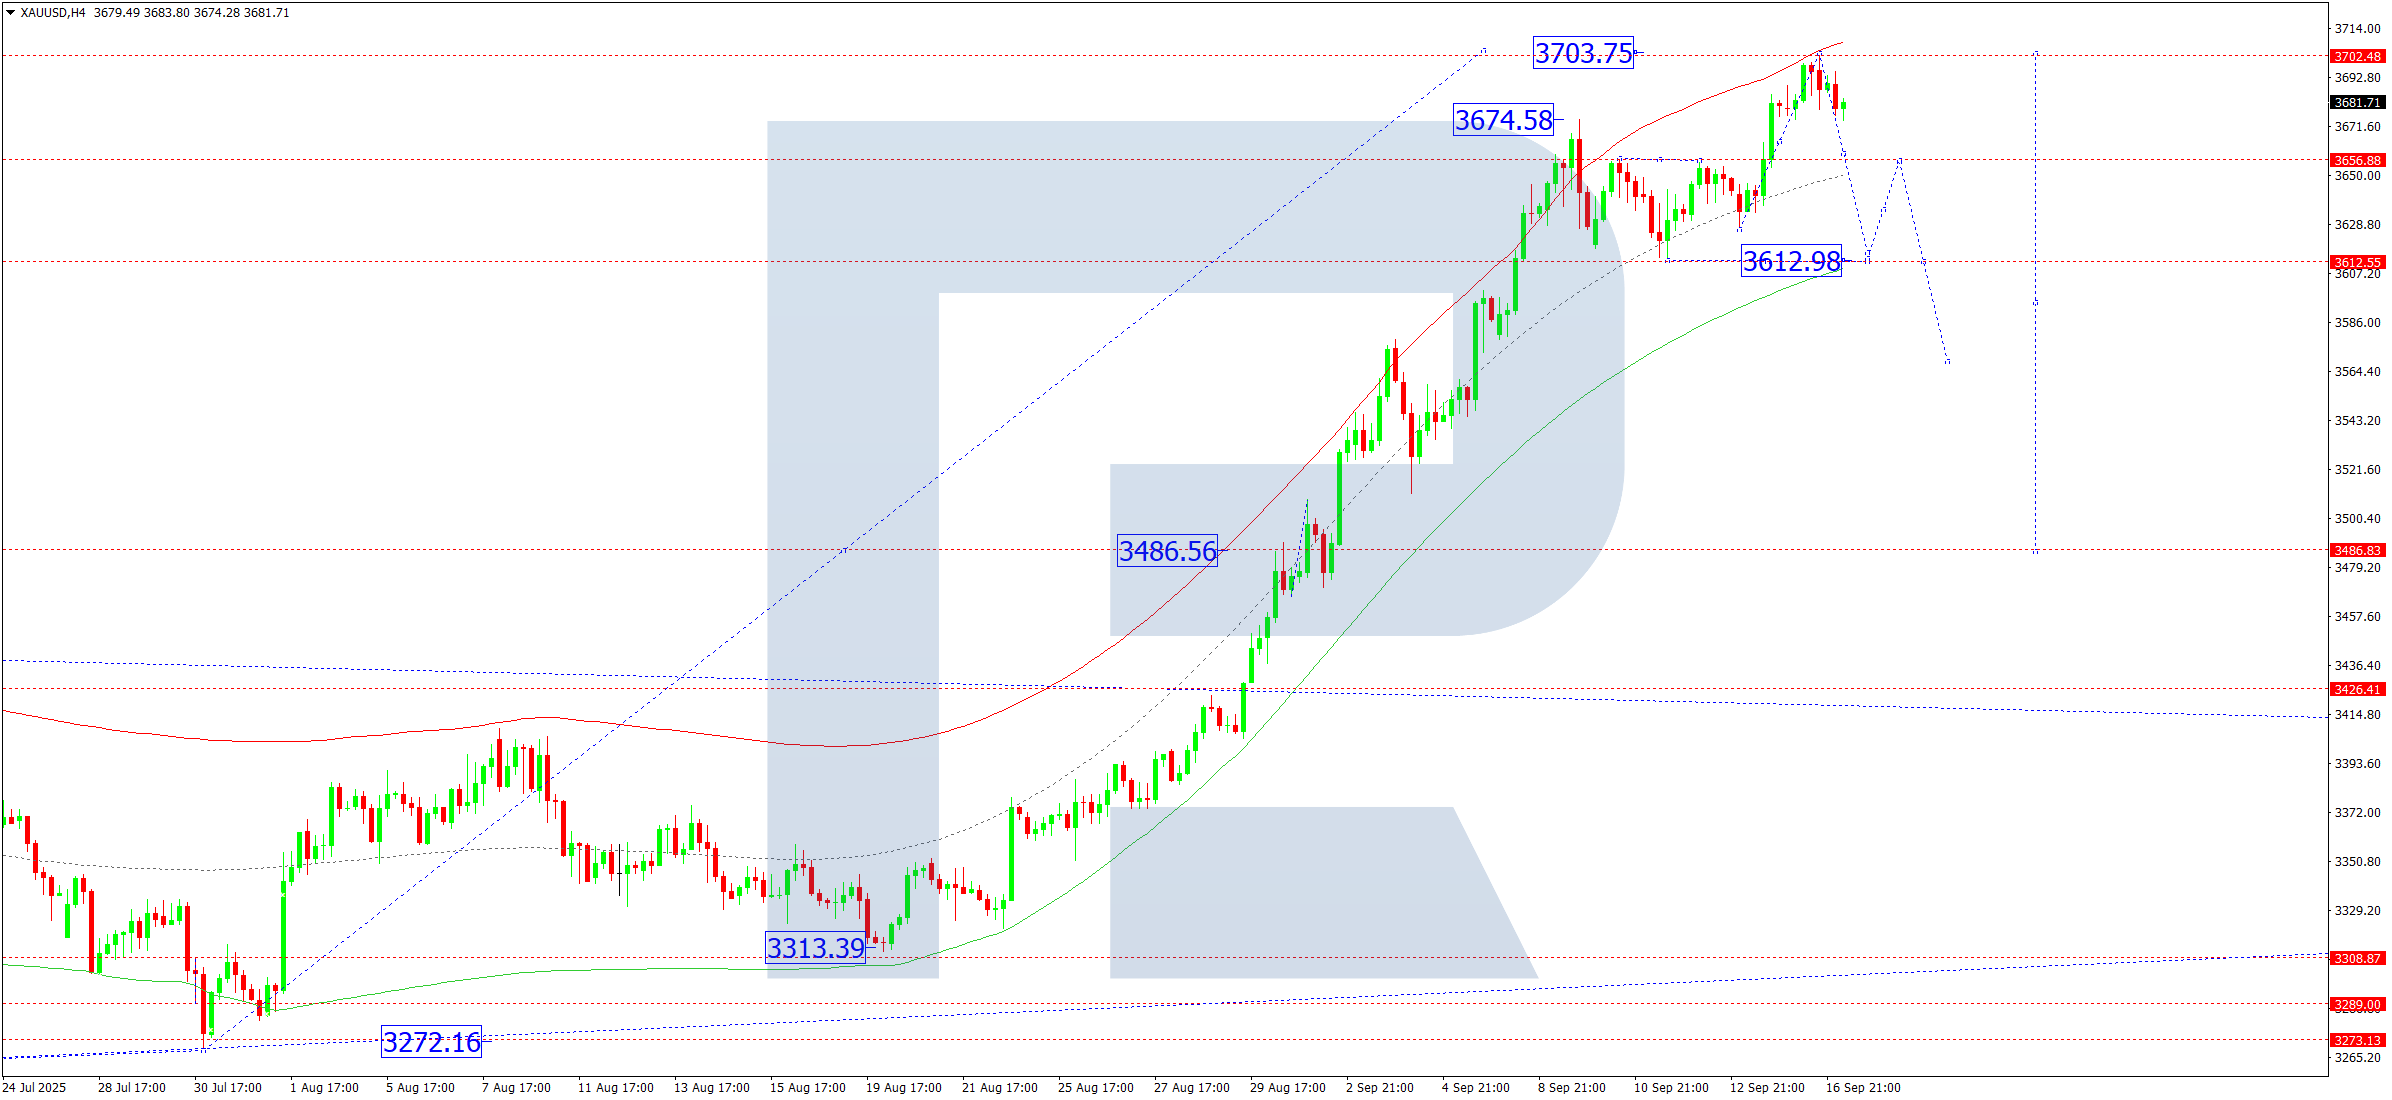
On the H4 chart of XAUUSD, the market completed a growth wave to 3,703. Today, 17 September 2025, a decline to 3,613 is expected, followed by growth to 3,656. A consolidation range may form around this level. A downward breakout would open potential for a decline to 3,486.
Technically, the Elliott wave structure and the growth wave matrix with a pivot at 3,486 confirm this scenario for XAUUSD. At the moment, the market reached the upper boundary of the Price Envelope at 3,703. A decline towards 3,613 is expected, with a further potential continuation to 3,486 if broken.
Technical indicators for today’s XAUUSD forecast suggest a downward wave to 3,613.
Brent forecast
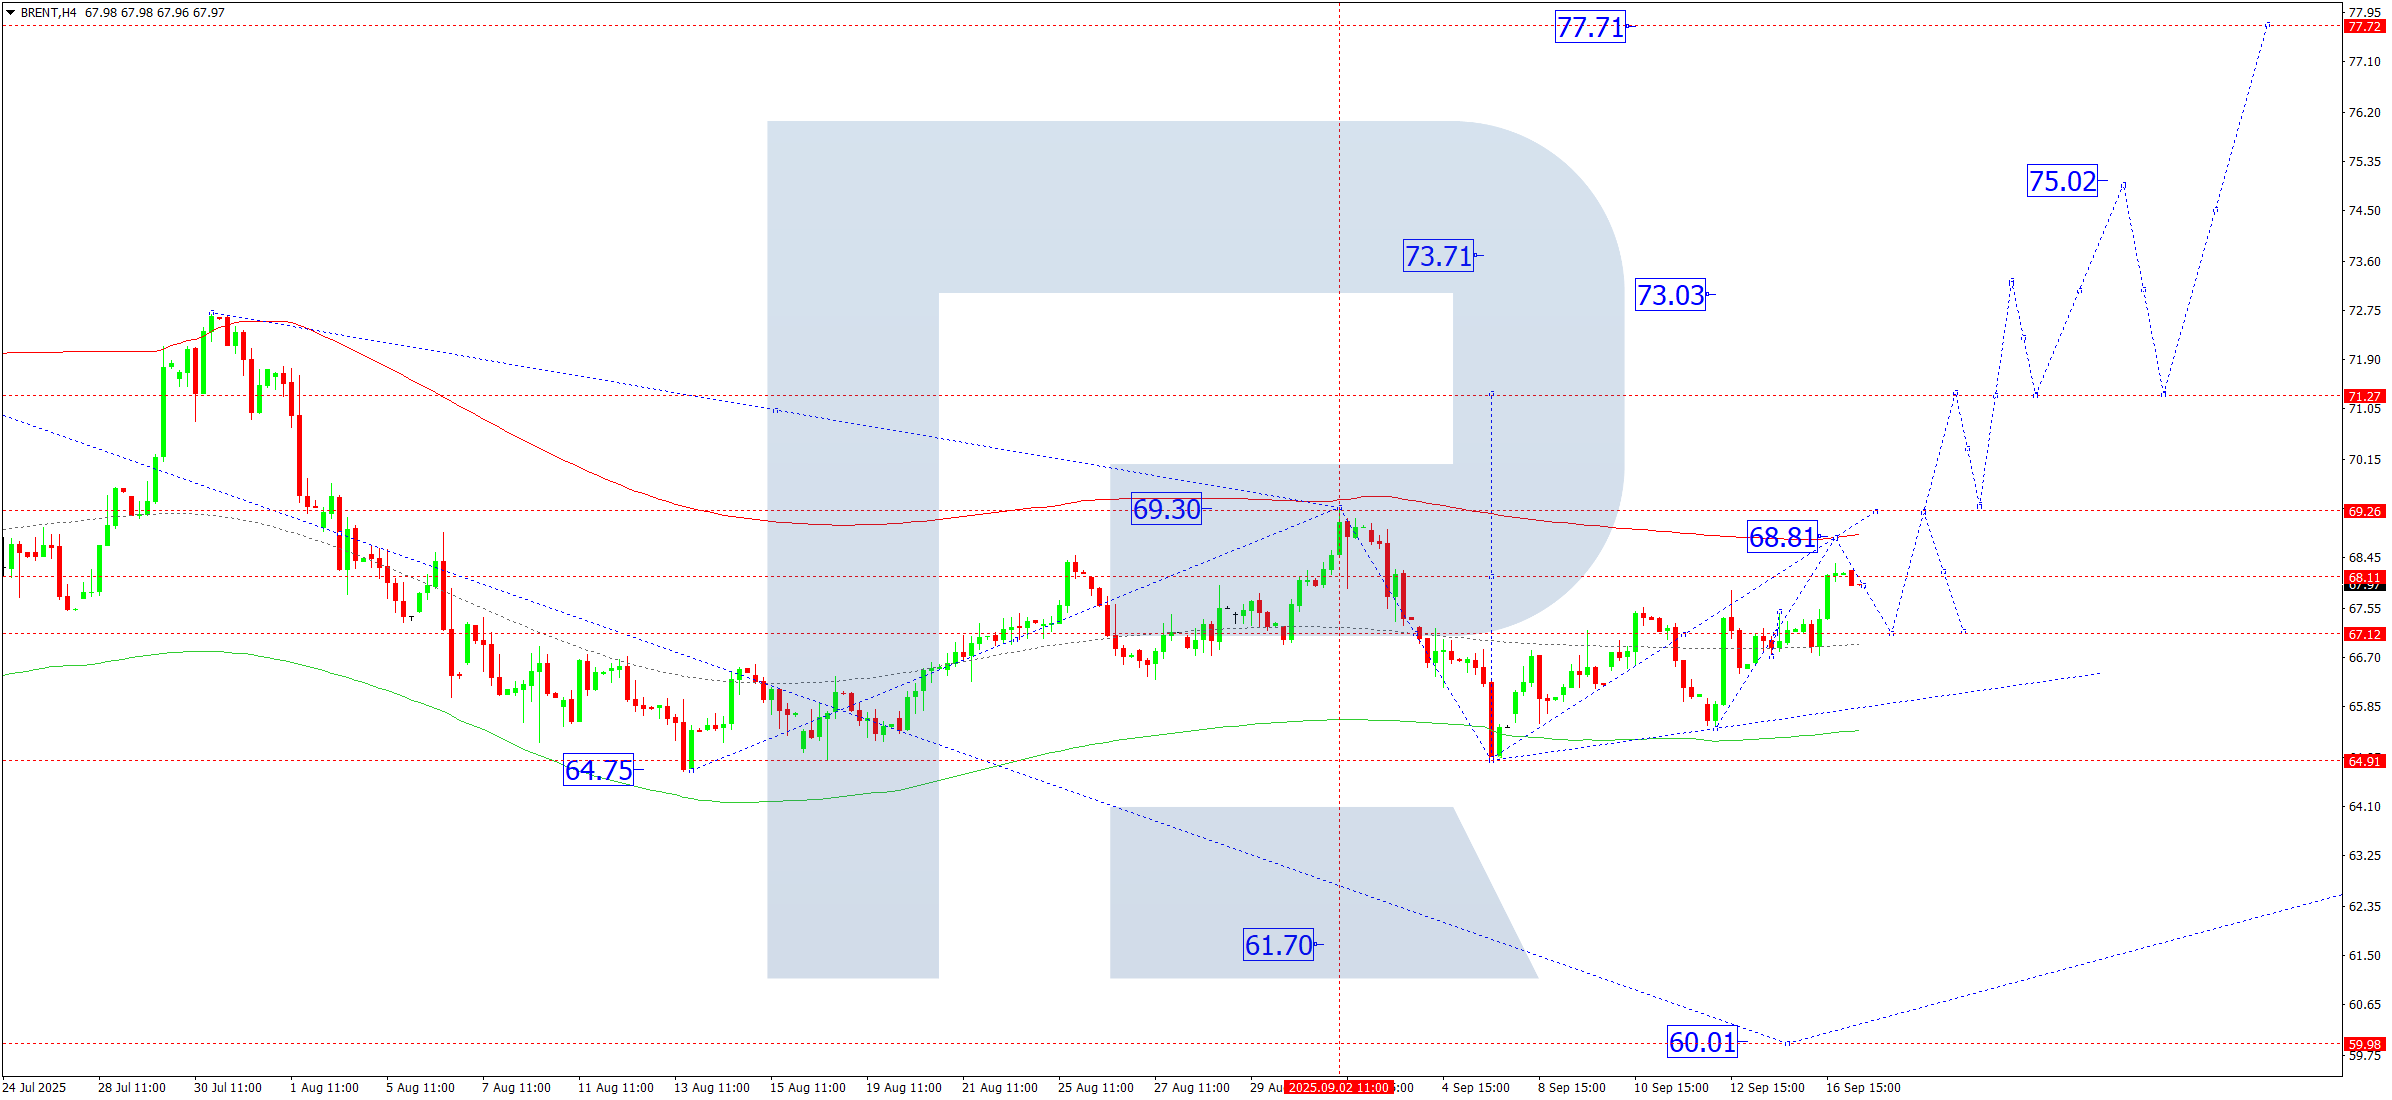
On the H4 chart of Brent, the market completed a growth wave to 68.34. Today, 17 September 2025, a continuation towards 69.30 is expected. Afterwards, a correction to 67.20 may occur, followed by growth to 71.30 with further continuation to 75.00, the local target.
Technically, the Elliott wave structure and the growth wave matrix with a pivot at 67.20 confirm this scenario for Brent. At the moment, the market continues a growth wave towards the upper boundary of the Price Envelope at 69.30. Later, a correction to its central line at 67.20 is possible.
Technical indicators for today’s Brent forecast suggest a growth wave to 69.30.
Open Account


