Daily technical analysis and forecast for 25 June 2025
Here is a detailed daily technical analysis and forecast for EURUSD, USDJPY, GBPUSD, AUDUSD, USDCAD, XAUUSD and Brent for 25 June 2025.
EURUSD forecast
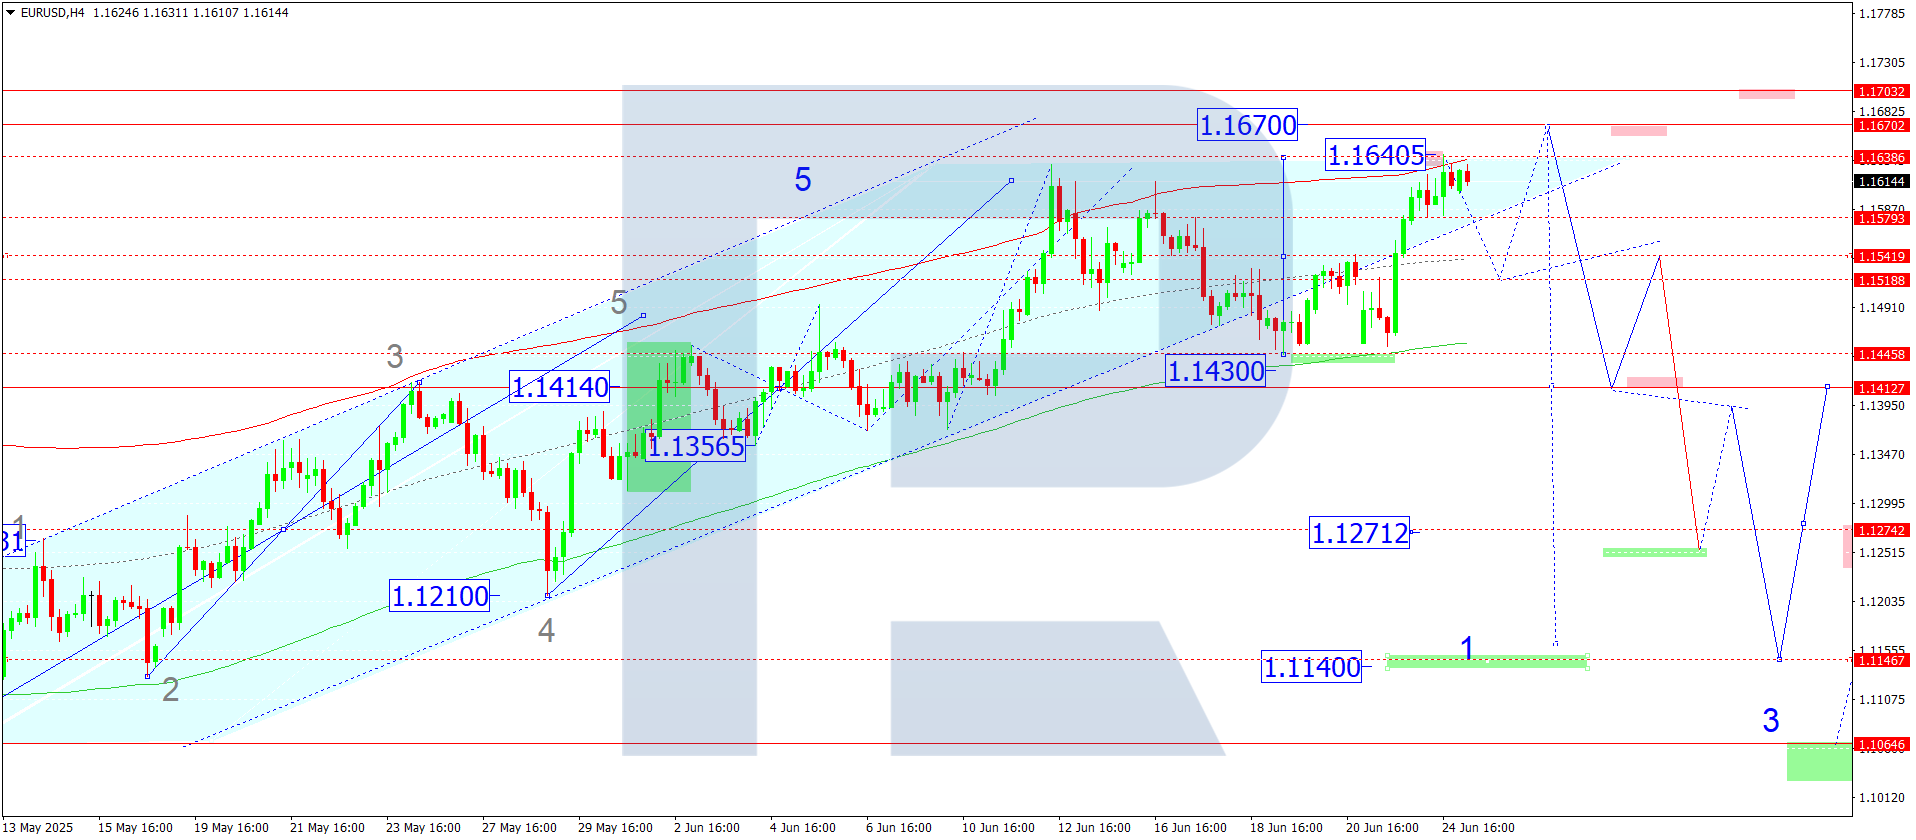
On the H4 chart of EURUSD, the market broke above 1.1540 and completed a growth wave to 1.1640. Today, 25 June 2025, a consolidation range is forming below this level. If the price breaks below 1.1580, a decline to 1.1518 may follow. After that, a rise towards 1.1670 is possible, followed by a potential drop to 1.1414 as the estimated target.
The Elliott wave structure and growth matrix with a pivot at 1.1550 support this scenario, marking it as key in EURUSD's wave formation. The market is currently consolidating around the central line of the price Envelope at 1.1550. A downward move to this central line is expected today, followed by a possible rise to the upper boundary at 1.1670.
Technical indicators for today’s EURUSD forecast suggest a downward wave to 1.1520.
USDJPY forecast
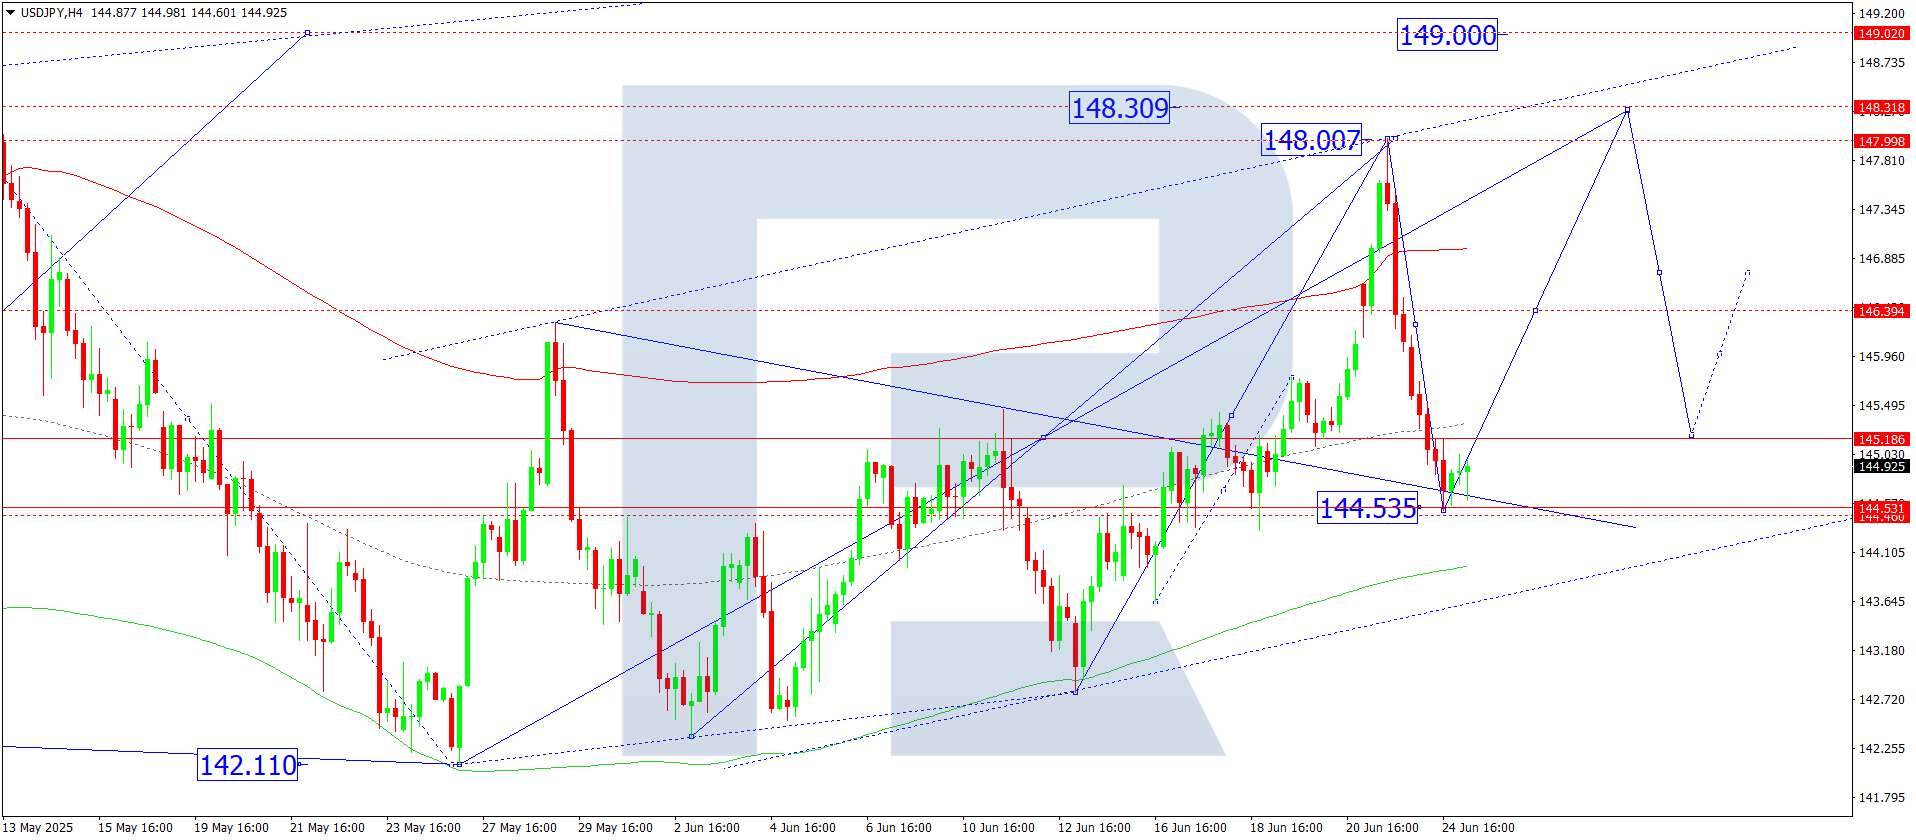
On the H4 chart of USDJPY, the market completed a decline to 144.54. Today, 25 June 2025, a rise to 146.40 is possible. If this level breaks upwards, the wave could continue to 148.30 and potentially extend to 149.00. Conversely, if the price breaks below 144.50, the wave may extend down to 142.10.
The Elliott wave structure and growth matrix with a pivot at 144.00 confirm this outlook and define it as key for USDJPY. The market recently reached the local growth target at the upper boundary of the price Envelope at 148.00 and pulled back to 144.55. Today, the market is expected to form a consolidation range around the central line at 145.00. Afterwards, another upward wave towards 148.30 may develop.
Technical indicators for today’s USDJPY forecast suggest a continued rise to 148.30.
GBPUSD forecast
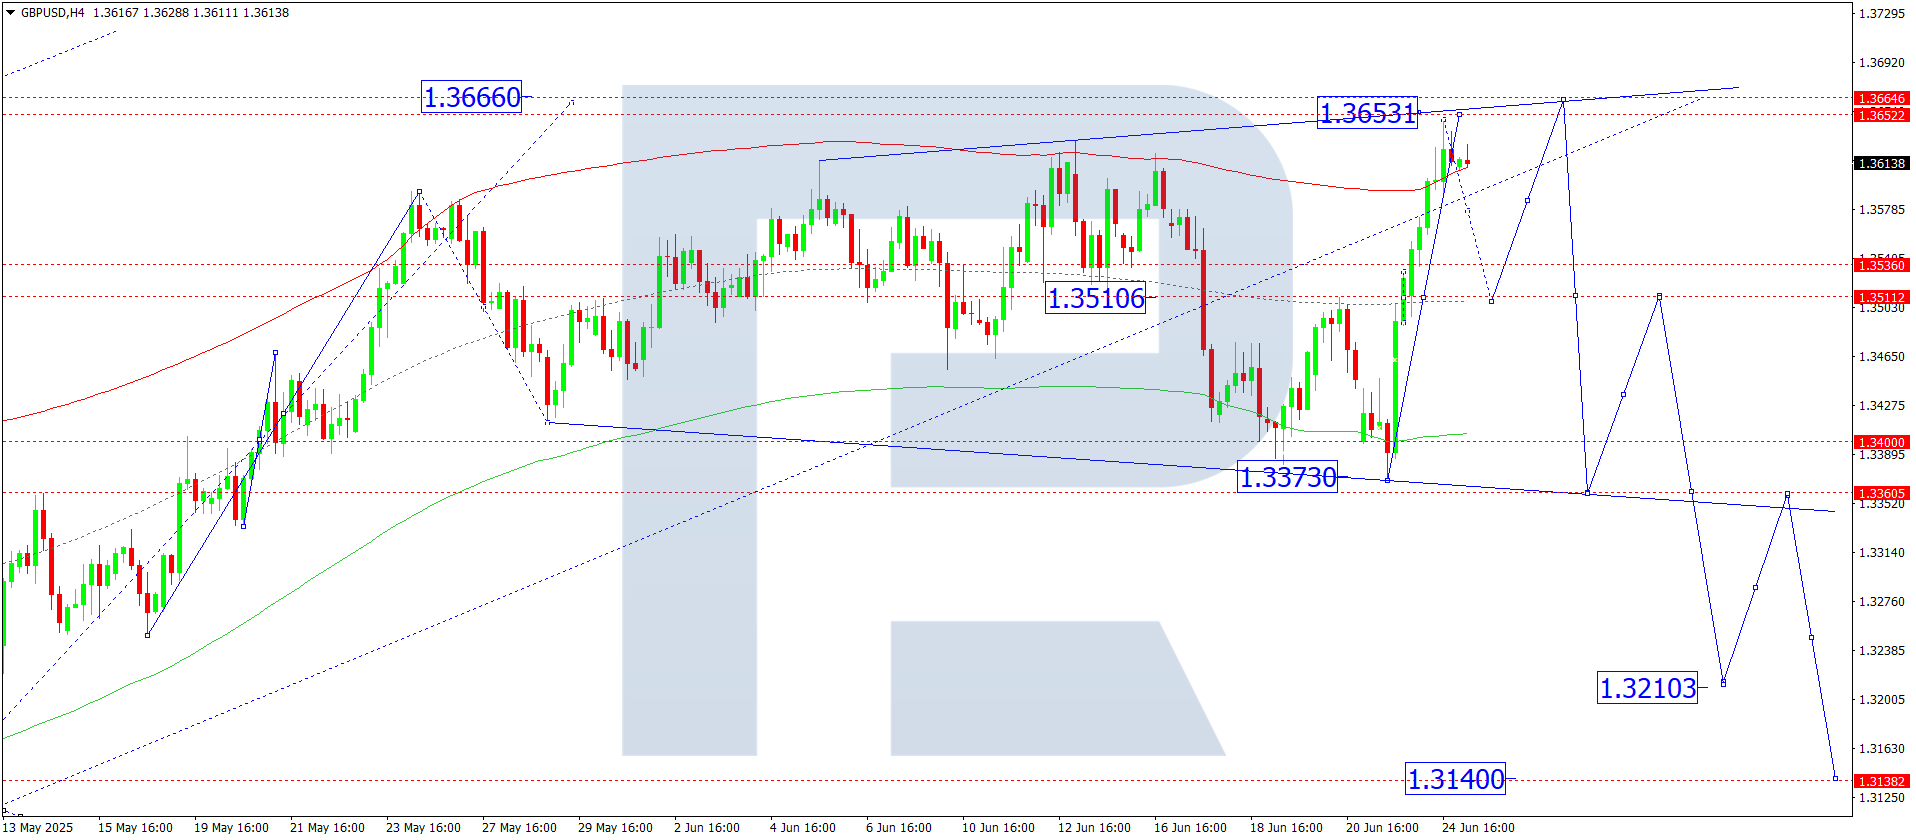
On the H4 chart of GBPUSD, the market completed a growth wave to 1.3648. Today, 25 June 2025, a decline to 1.3511 is possible, followed by a rise to 1.3655. A broad consolidation range is forming around 1.3500. If the market breaks downwards, the wave may continue to 1.3370 and 1.3200. If it breaks upwards, the range could expand to 1.3660 before a likely drop to 1.3200.
The Elliott wave structure and the decline matrix with a pivot at 1.3500 support this outlook, making it key in GBPUSD’s current wave structure. The market is now forming a wave towards the upper boundary of the price Envelope at 1.3655. Afterwards, a decline to the lower boundary at 1.3370 may follow.
Technical indicators for today’s GBPUSD forecast suggest a decline to 1.3500.
AUDUSD forecast
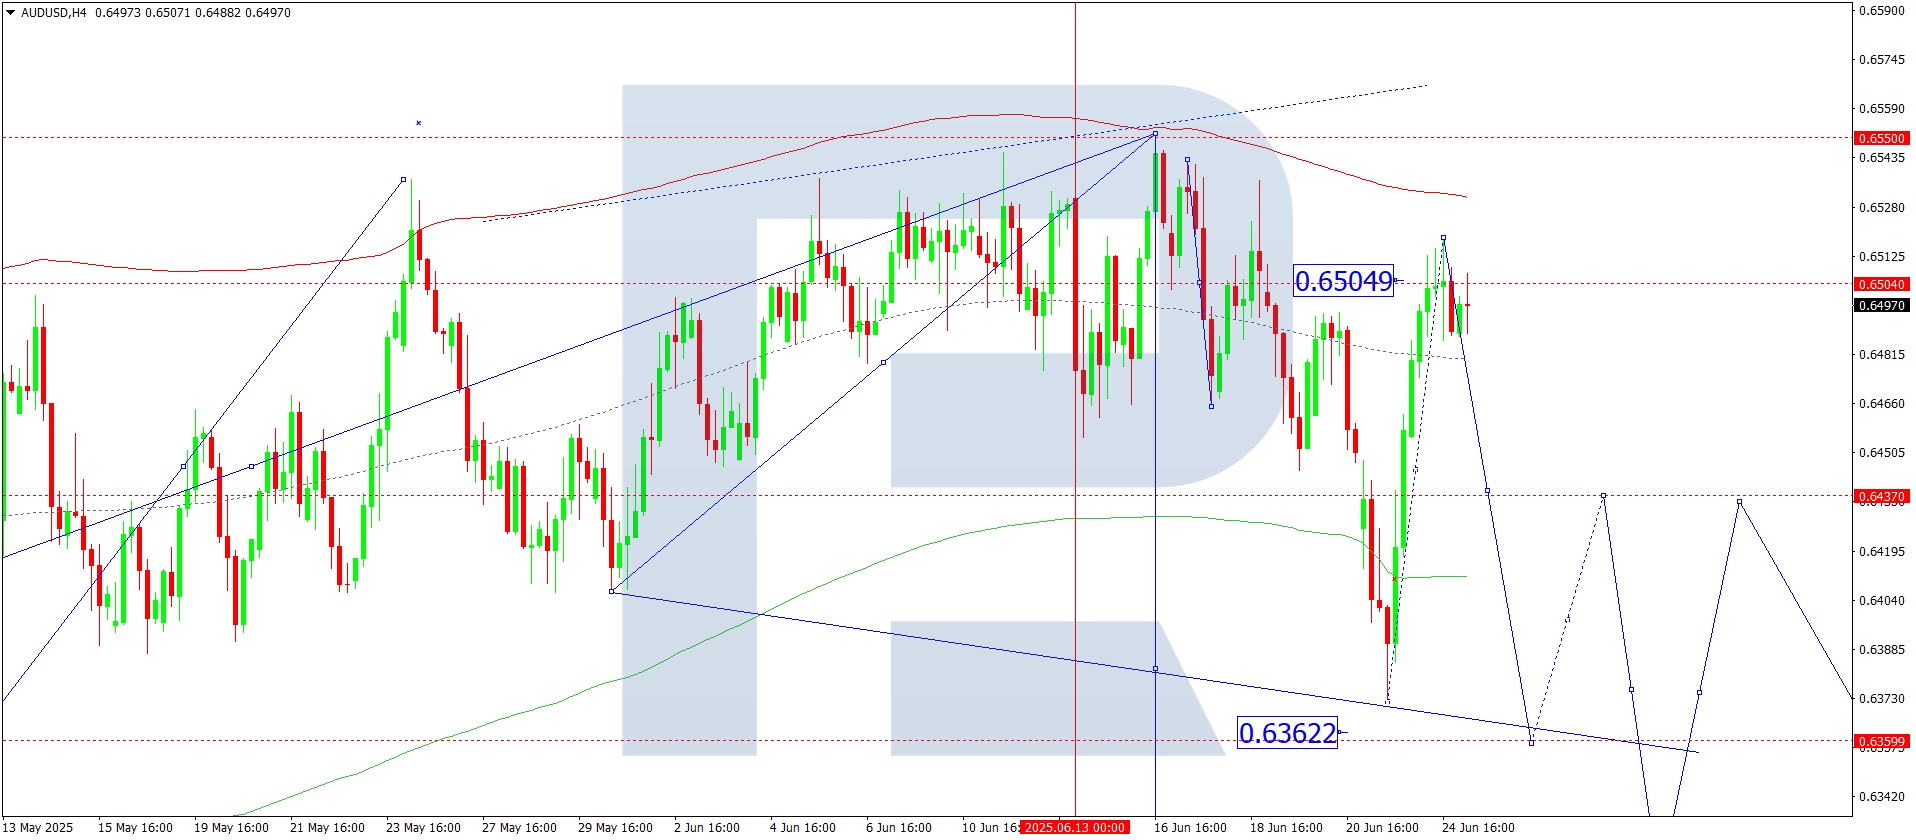
On the H4 chart of AUDUSD, the market completed a corrective wave to 0.6550. Today, 25 June 2025, the correction is expected to end, and a new downward wave to 0.6360 may begin. This is the local target. After that, a rebound to 0.6444 is possible, followed by a decline to 0.6320 as the main target.
The Elliott wave structure and the decline matrix with a pivot at 0.6500 support this outlook, making it key in AUDUSD’s current wave formation. The market has already reached the central line of the price Envelope at 0.6500 and is beginning a downward move to its lower boundary at 0.6360.
Technical indicators for today’s AUDUSD forecast suggest another downward wave to 0.6360.
USDCAD forecast
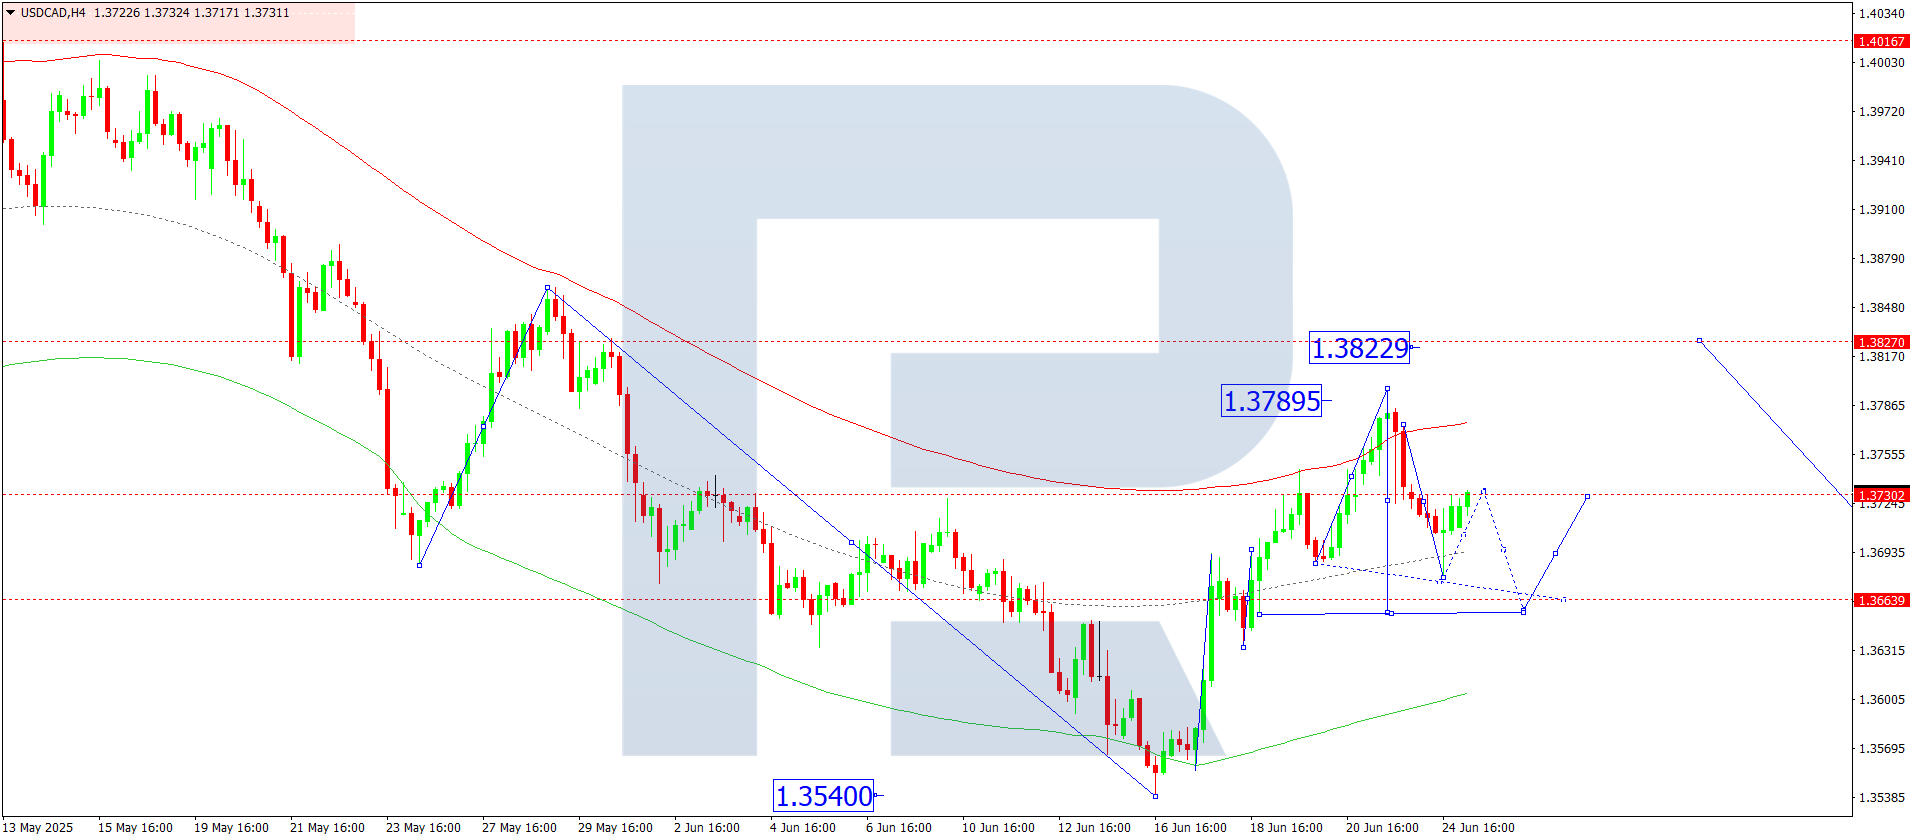
On the H4 chart of USDCAD, the market completed a correction to 1.3680. Today, 25 June 2025, a rise to 1.3740 is possible. The market continues to develop a wide consolidation range around 1.3666. If the market breaks upwards, the wave may continue to 1.3822. If it breaks downwards, the wave may extend to 1.3540.
The Elliott wave structure and the growth matrix with a pivot at 1.3666 confirm this scenario, identifying it as key for USDCAD’s wave. The market recently hit the local growth target at the upper boundary of the price Envelope at 1.3790. Today, a correction towards the central line at 1.3666 is possible, followed by growth towards the upper boundary at 1.3822.
Technical indicators for today’s USDCAD forecast suggest a decline to 1.3666.
XAUUSD forecast
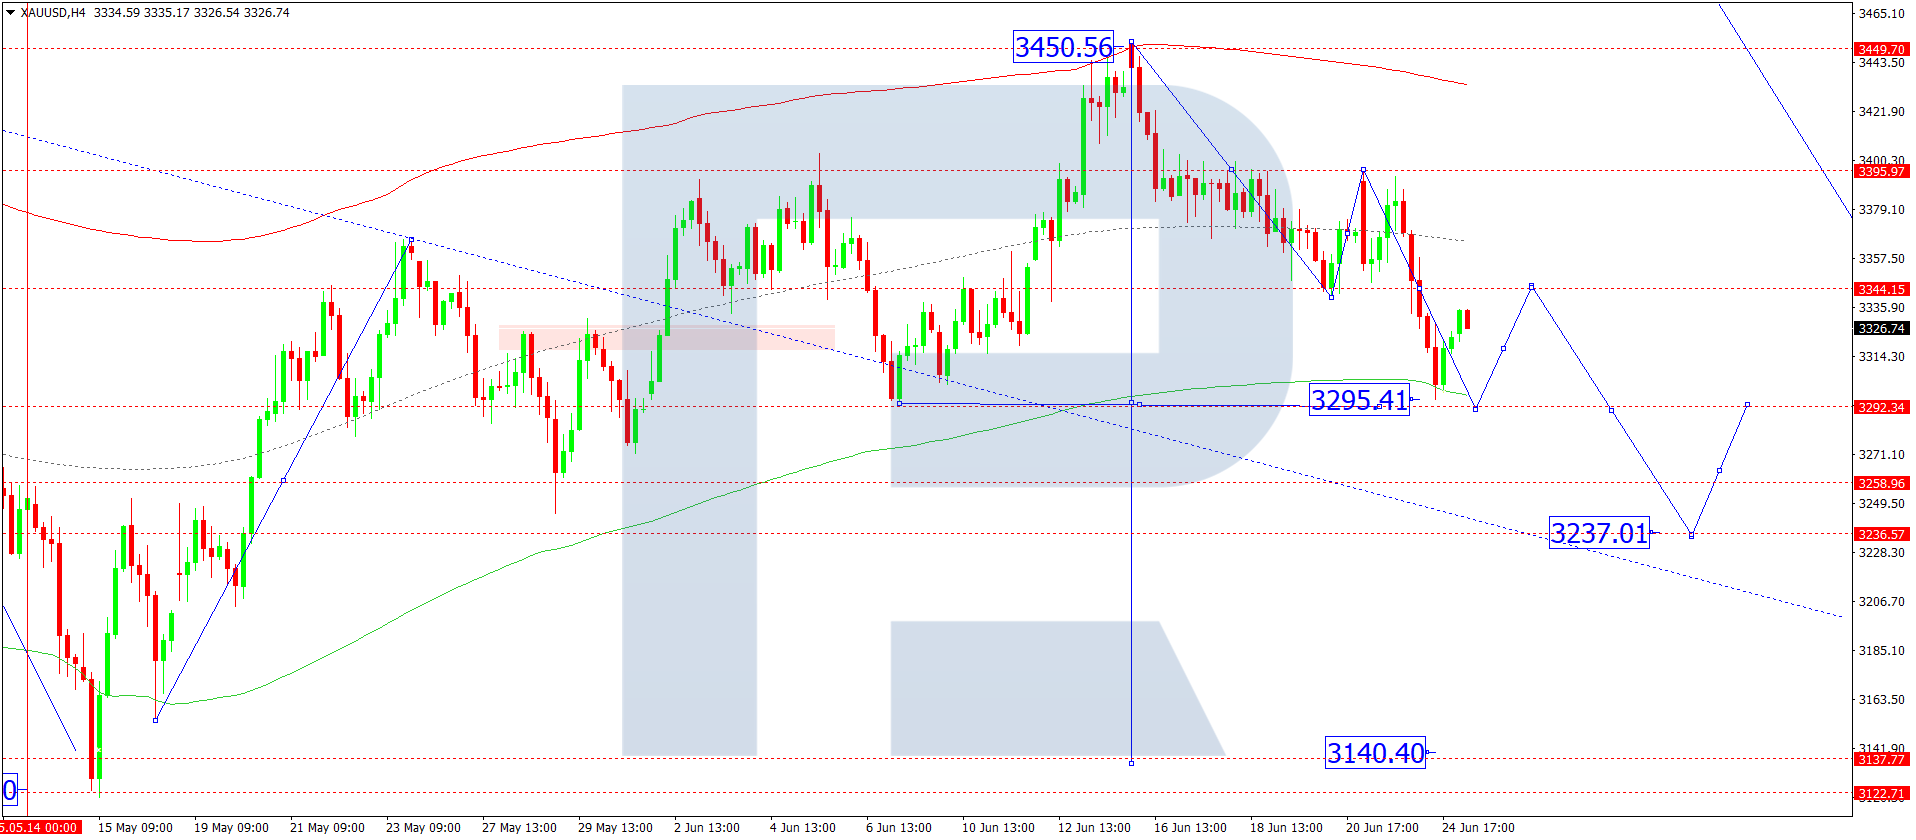
On the H4 chart of XAUUSD, the market broke below 3,344 and is forming a downward wave towards 3,292. Today, 25 June 2025, this target level is expected to be reached. Afterwards, a rise towards 3,344 may develop. A broad consolidation range is forming around 3,344. Later, another downward wave towards 3,237 may follow.
The Elliott wave structure and the decline matrix with a pivot at 3,344 support this outlook, defining it as key in the current wave. The market previously consolidated around the central line of the price Envelope at 3,344 and broke down. Today, a continued decline towards the lower boundary at 3,292 is relevant.
Technical indicators for today’s XAUUSD forecast point to a continued downward wave to 3,292.
Brent forecast
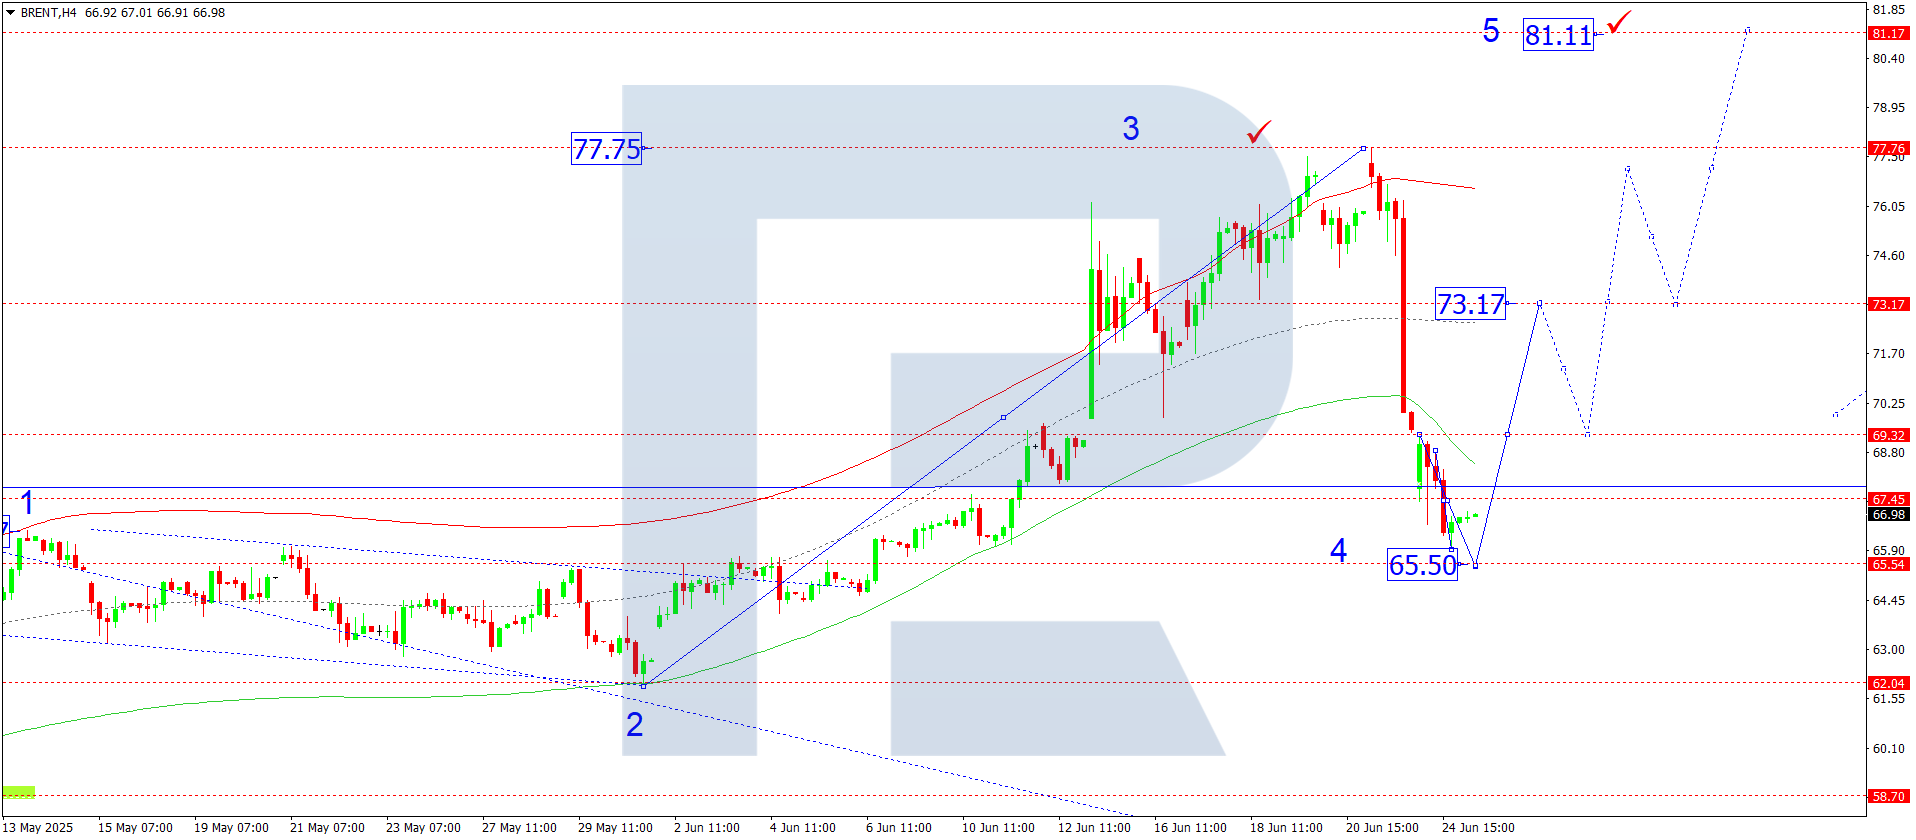
On the H4 chart of Brent crude, the market completed a correction wave to 66.00. Today, 25 June 2025, another downward move to 65.50 is possible. Afterwards, a new upward wave may begin towards 73.17 as the first target within a larger growth wave towards 81.11.
The Elliott wave structure and growth matrix with a pivot at 70.00 confirm this outlook, making it key in Brent’s current wave. The market is now forming a correction structure towards the lower boundary of the price Envelope at 65.50. Then, a rise towards the central line at 73.17 is expected. Later, a move to the upper boundary at 81.11 remains relevant.
Technical indicators for today’s Brent forecast suggest the start of an upward wave towards 73.17.


