Daily technical analysis and forecast for 30 October 2025
Here is a detailed daily technical analysis and forecast for EURUSD, USDJPY, GBPUSD, AUDUSD, USDCAD, XAUUSD and Brent for 30 October 2025.
EURUSD forecast
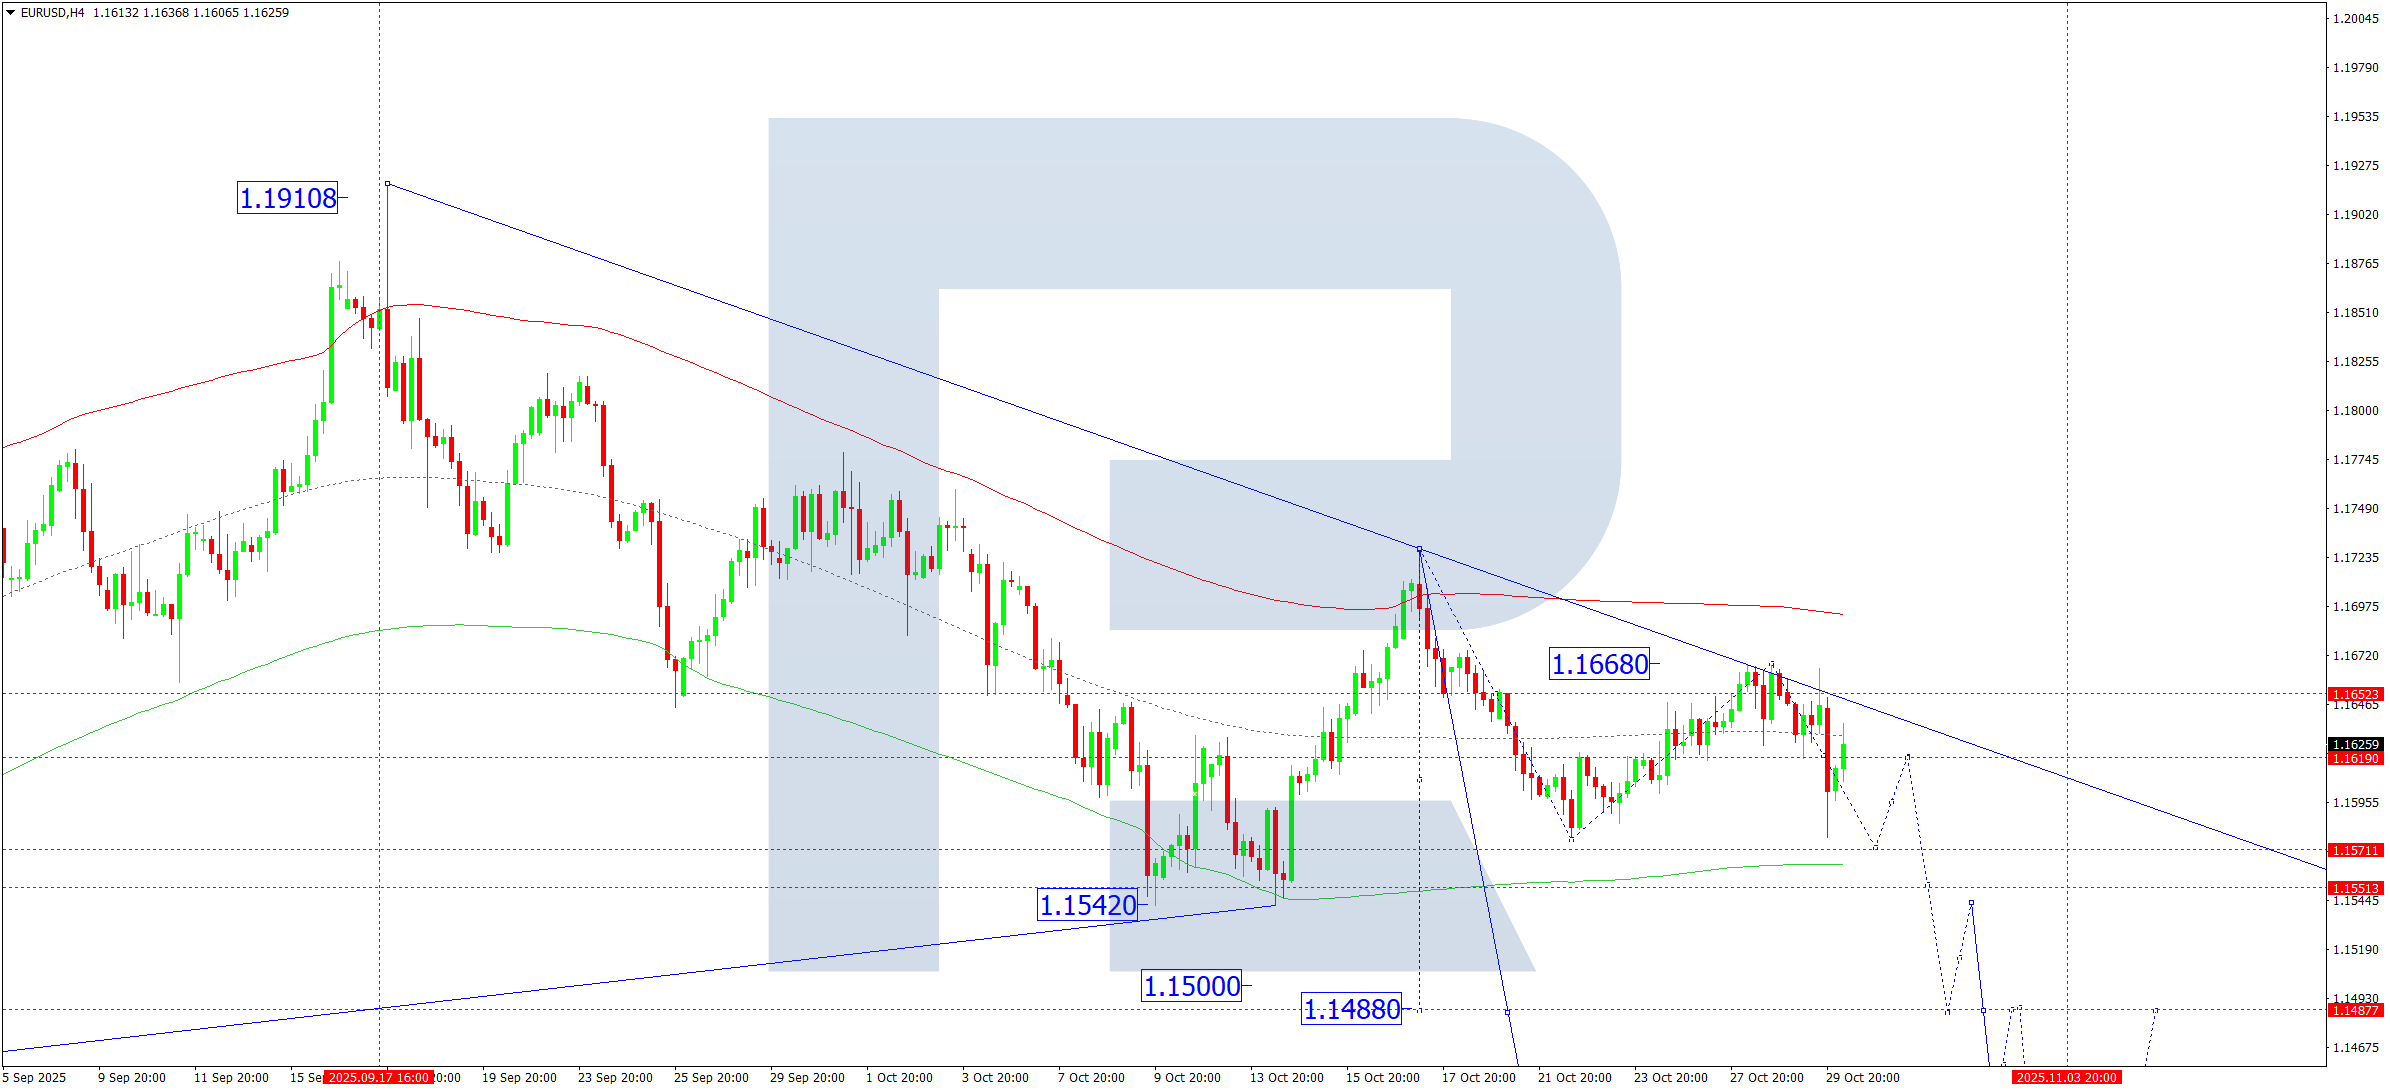
On the H4 chart, EURUSD completed a downward wave to 1.1577 and a correction to 1.1636. On 30 October 2025, the pair is expected to decline to 1.1570 before correcting towards 1.1606. The market continues to form a broad consolidation range around 1.1606. A breakout to the downside would open potential for a continuation towards 1.1550, with prospects of extending the trend down to 1.1488. This represents only half of the third downward wave, with the main target located near 1.1240.
Technically, this scenario is confirmed by the Elliott Wave structure and the bearish wave matrix with a pivot point at 1.1730, which is key in EURUSD’s wave structure. Today, a move towards the lower boundary of the Price Envelope at 1.1570 is expected, followed by a rise towards its central line at 1.1606.
Technical indicators for today’s EURUSD forecast suggest declines to 1.1570 and 1.1550.
USDJPY forecast
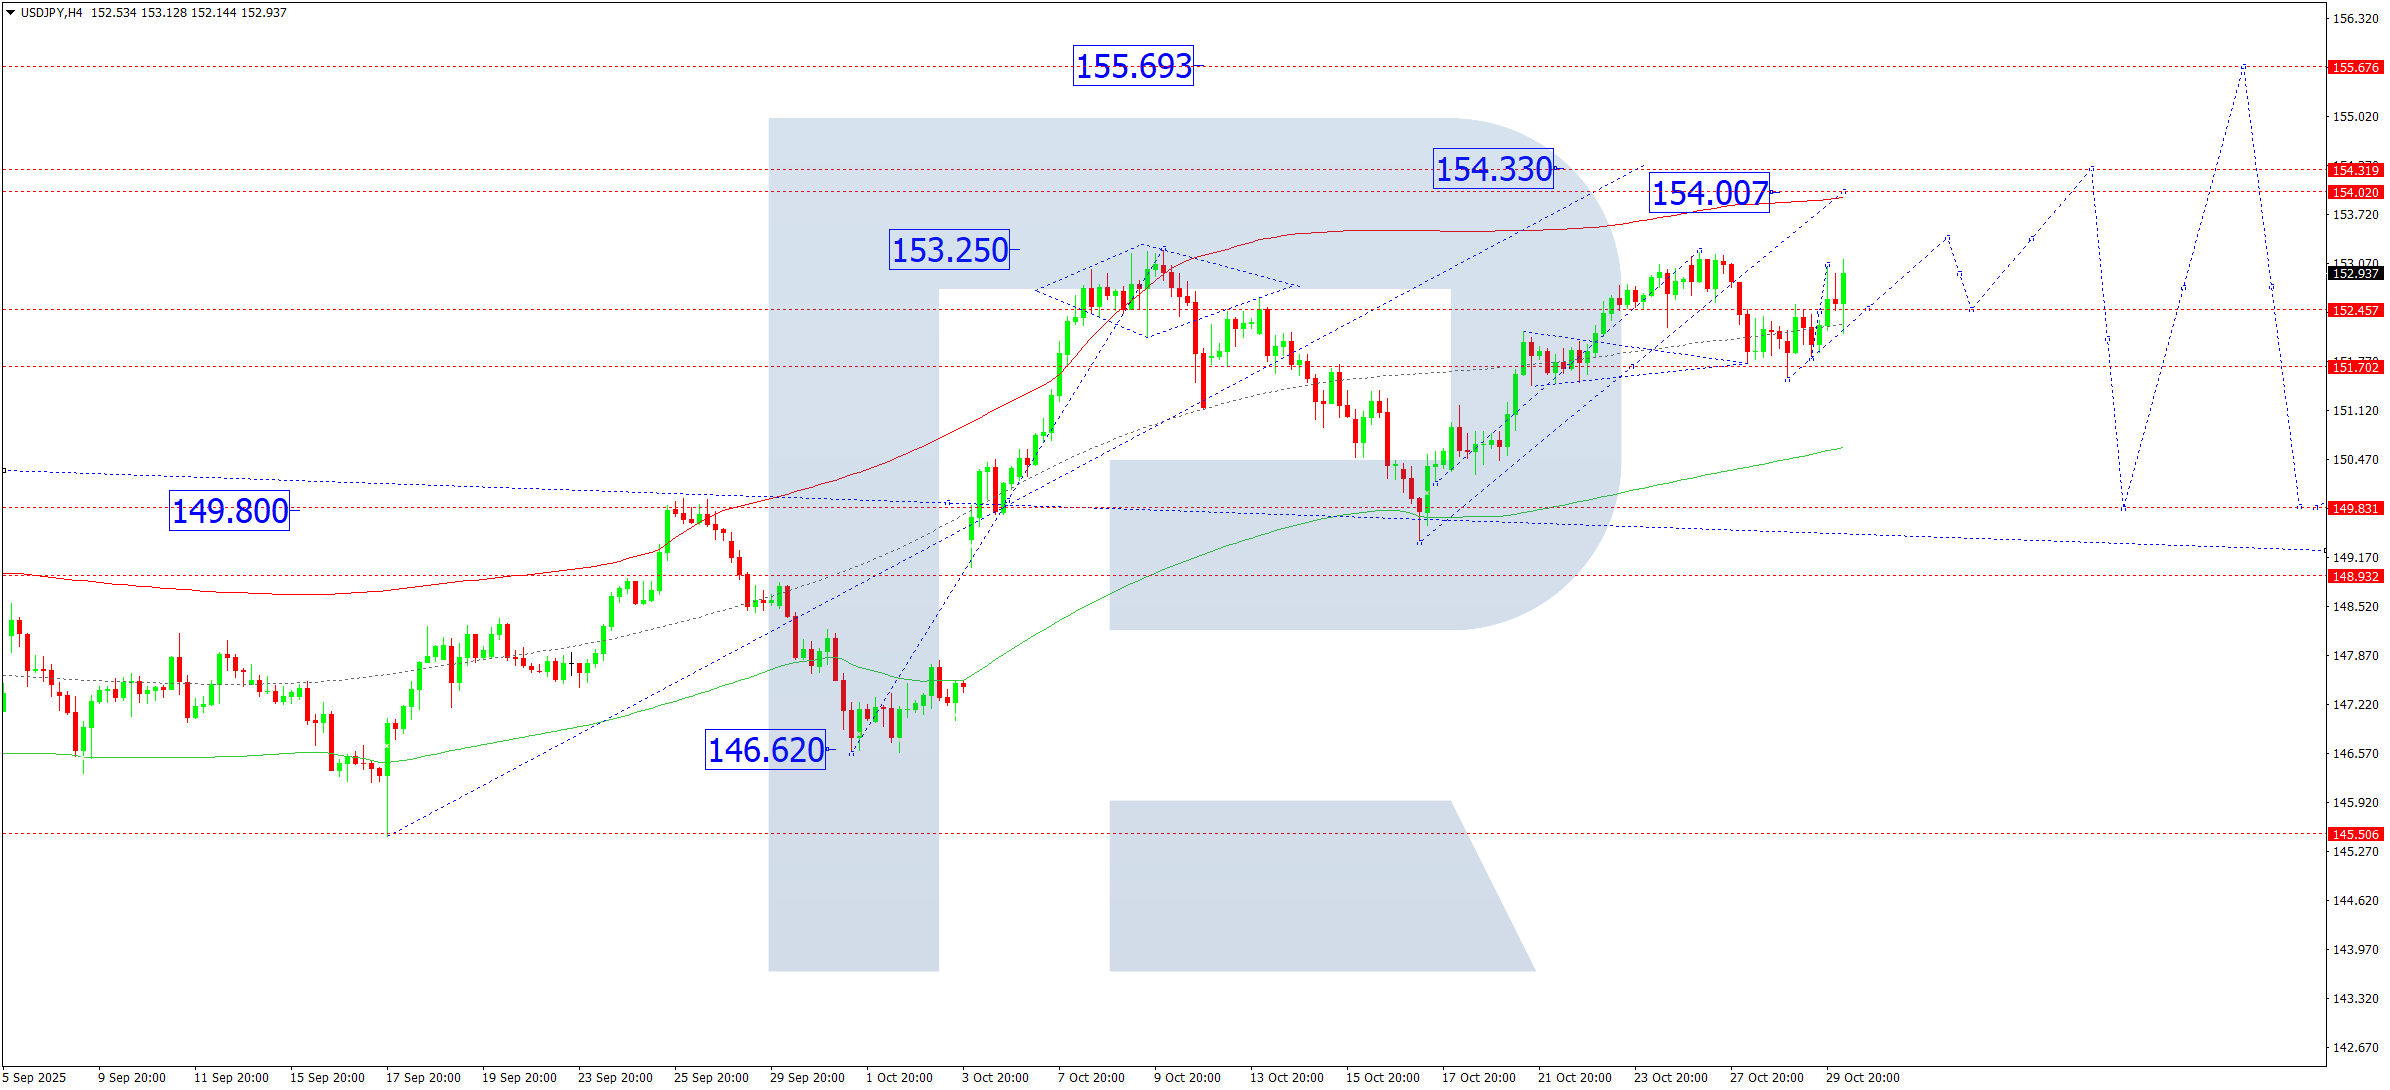
On the H4 chart, USDJPY completed a correction to 151.54 and began to develop an upward wave towards 153.40. On 30 October 2025, this target level is expected to be reached, followed by a correction to 152.46. The market continues to form a consolidation range around this level. A breakout above 152.46 would open potential for a continued upward move towards 154.00, with possible extension to 154.33 as the local estimated target.
Technically, this scenario is confirmed by the Elliott Wave structure and the bullish wave matrix with a pivot point at 149.80, which is key for this wave. The market has formed a consolidation around the central line of the Price Envelope at 152.46, with further continuation expected towards its upper boundary at 154.33.
Technical indicators for today’s USDJPY forecast suggest potential growth towards 154.00 and 154.33.
GBPUSD forecast
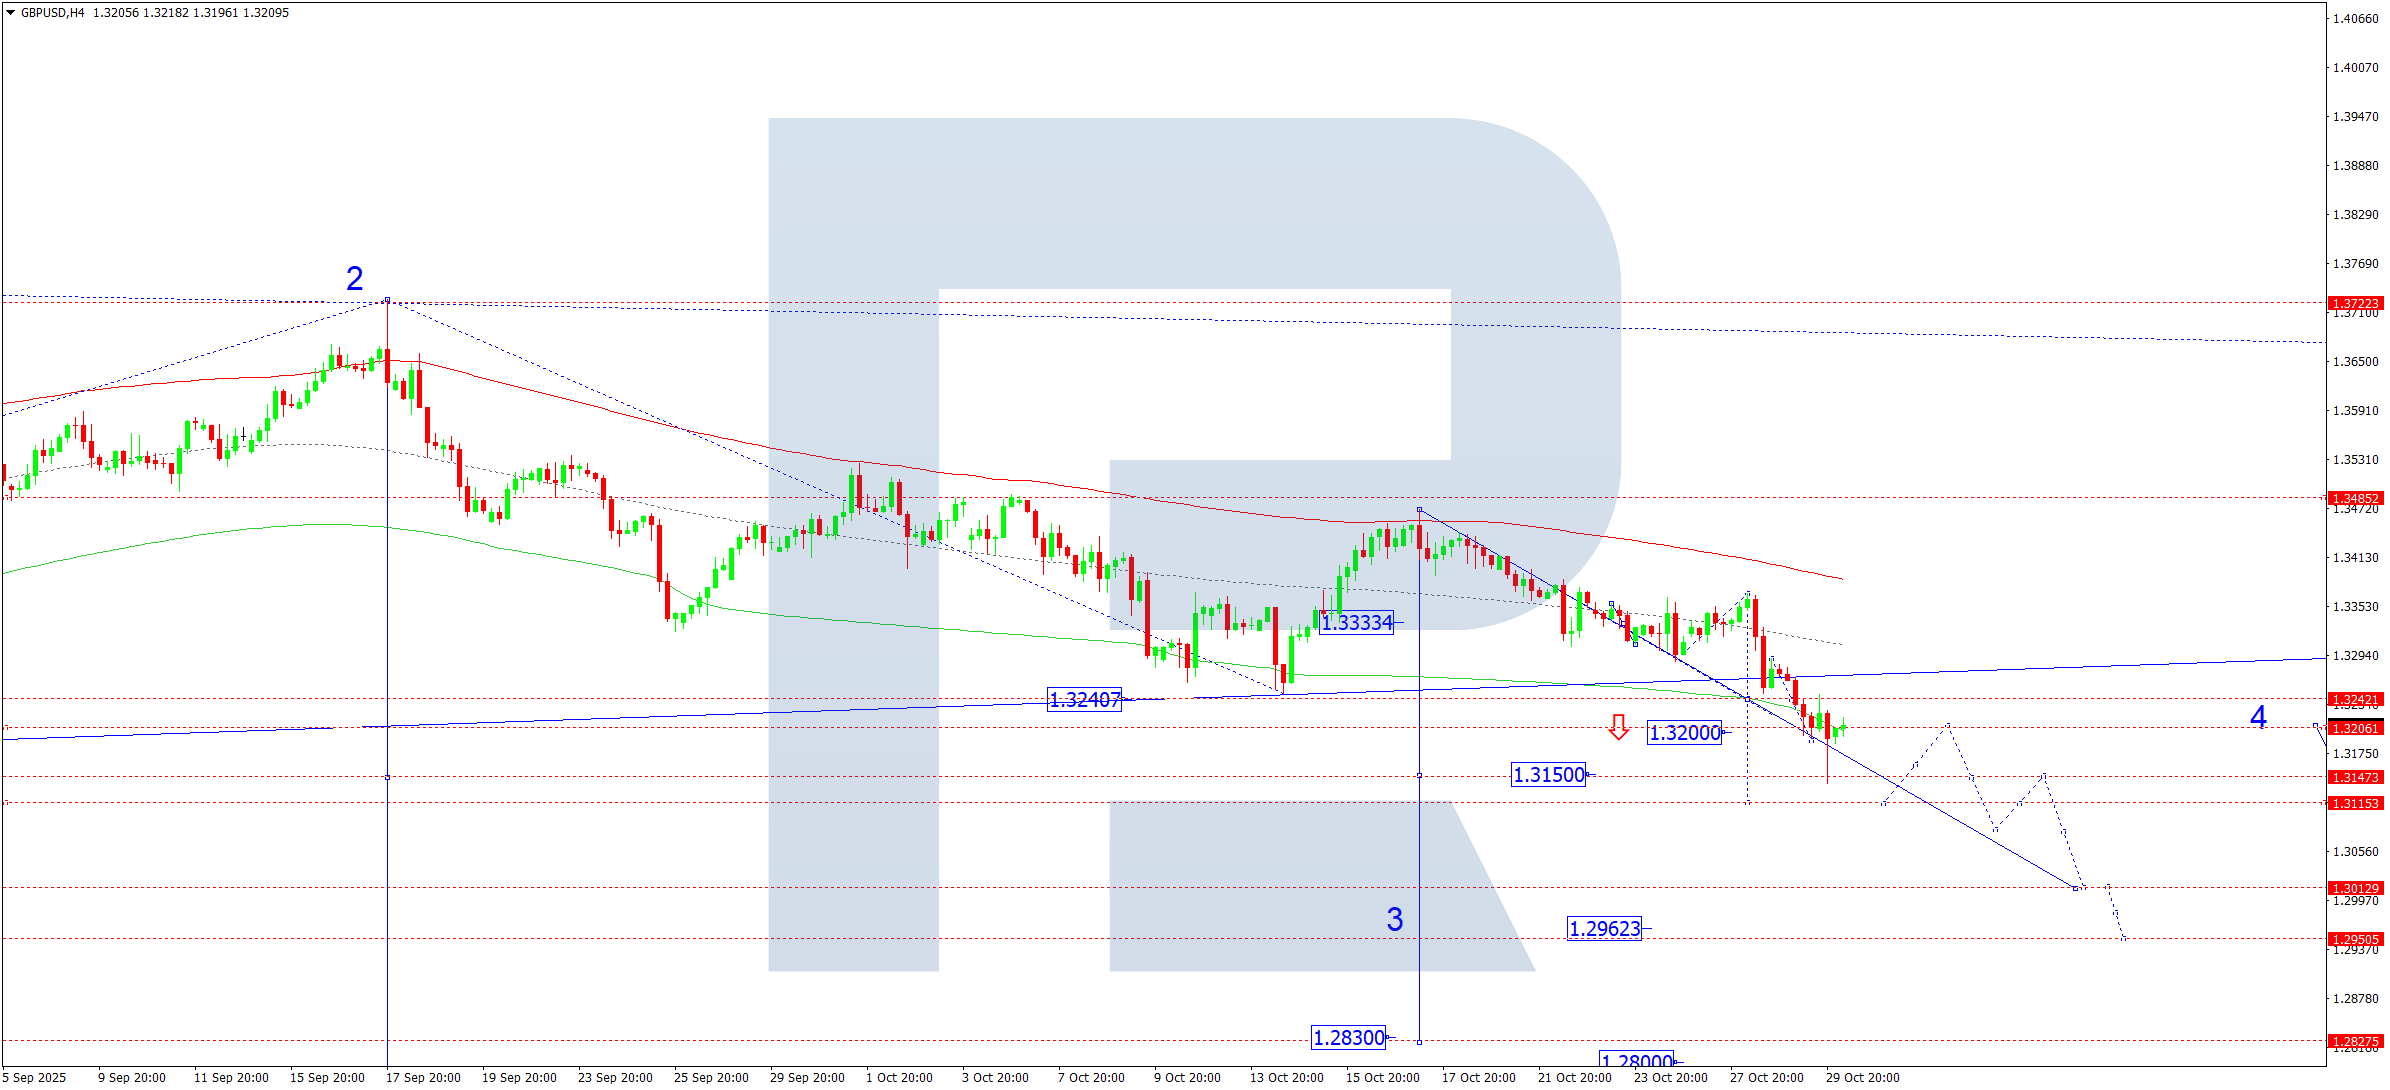
On the H4 chart, GBPUSD formed a consolidation range around 1.3242 and broke downwards. The local target of the decline has been reached at 1.3150, followed by a correction to 1.3206 (testing from below). On 30 October 2025, the third downward wave in the overall downtrend is expected to continue, with the next target at 1.3111 and potential extension to 1.3013. The main target of the third wave is near 1.2962.
Technically, this scenario is confirmed by the Elliott Wave structure and the bearish wave matrix with a pivot point at 1.3242, which is key for this wave. The market is consolidating around the central line of the Price Envelope at 1.3242. Today, the wave could continue towards the lower boundary at 1.3111.
Technical indicators for today’s GBPUSD forecast suggest a decline towards 1.3111.
AUDUSD forecast
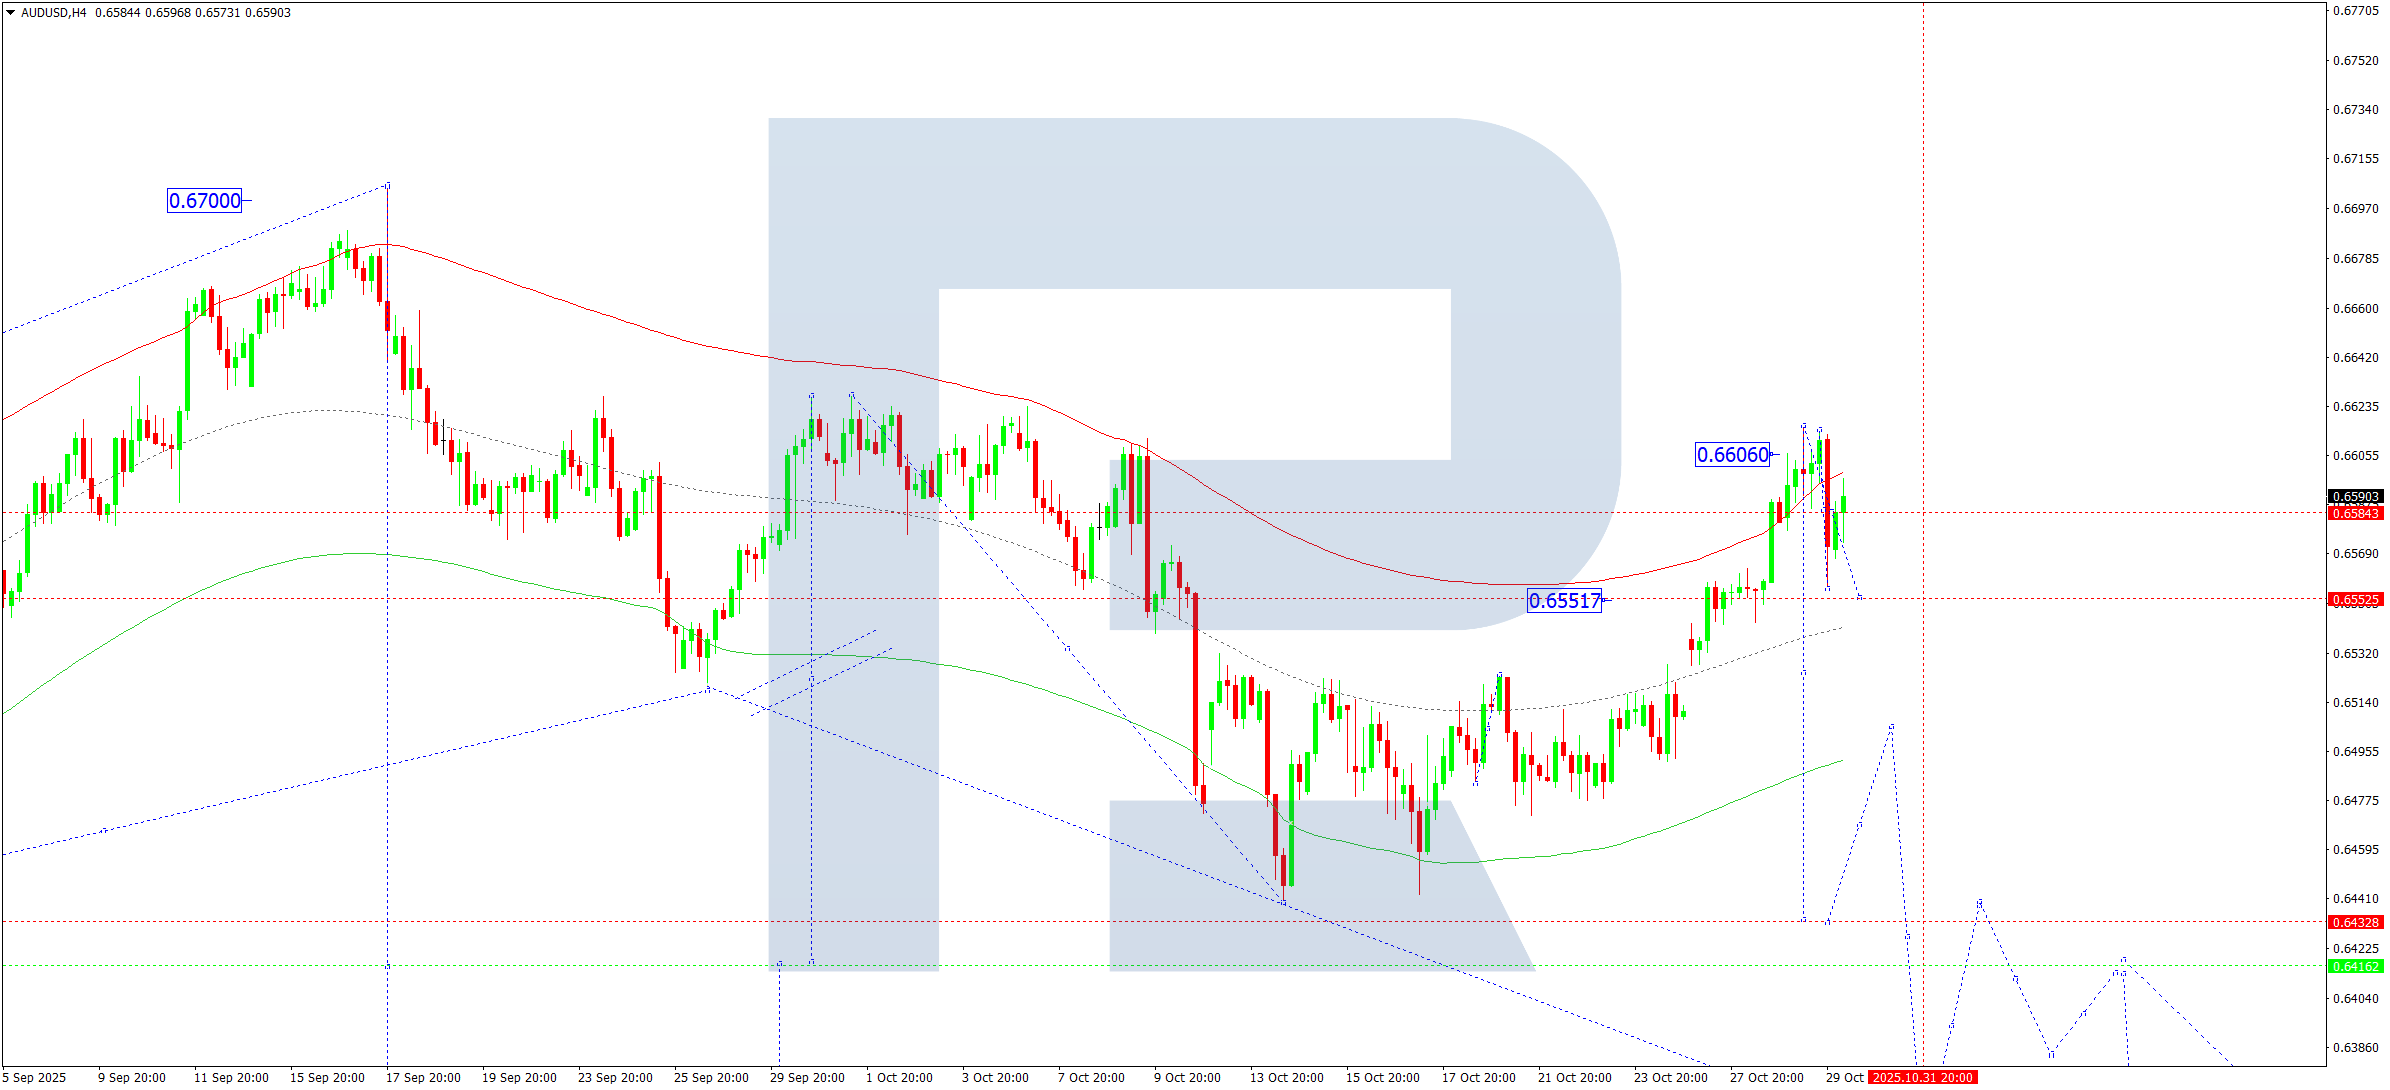
On the H4 chart, AUDUSD expanded its consolidation range towards 0.6616. On 30 October 2025, the pair is forming a downward wave towards 0.6551, followed by a rise to 0.6580. The market will likely define the boundaries of a new consolidation range at the top of the corrective wave. A breakout to the downside would open potential for a continued move towards 0.6432 and possibly further to 0.6350.
Technically, this scenario is confirmed by the Elliott Wave structure and the bearish wave matrix with a pivot point at 0.6550, viewed as key for this wave. The market completed a correction towards the upper boundary of the Price Envelope at 0.6616, with a decline towards the lower boundary at 0.6432 expected today.
Technical indicators for today’s AUDUSD forecast suggest the beginning of a downward wave towards 0.6432.
USDCAD forecast
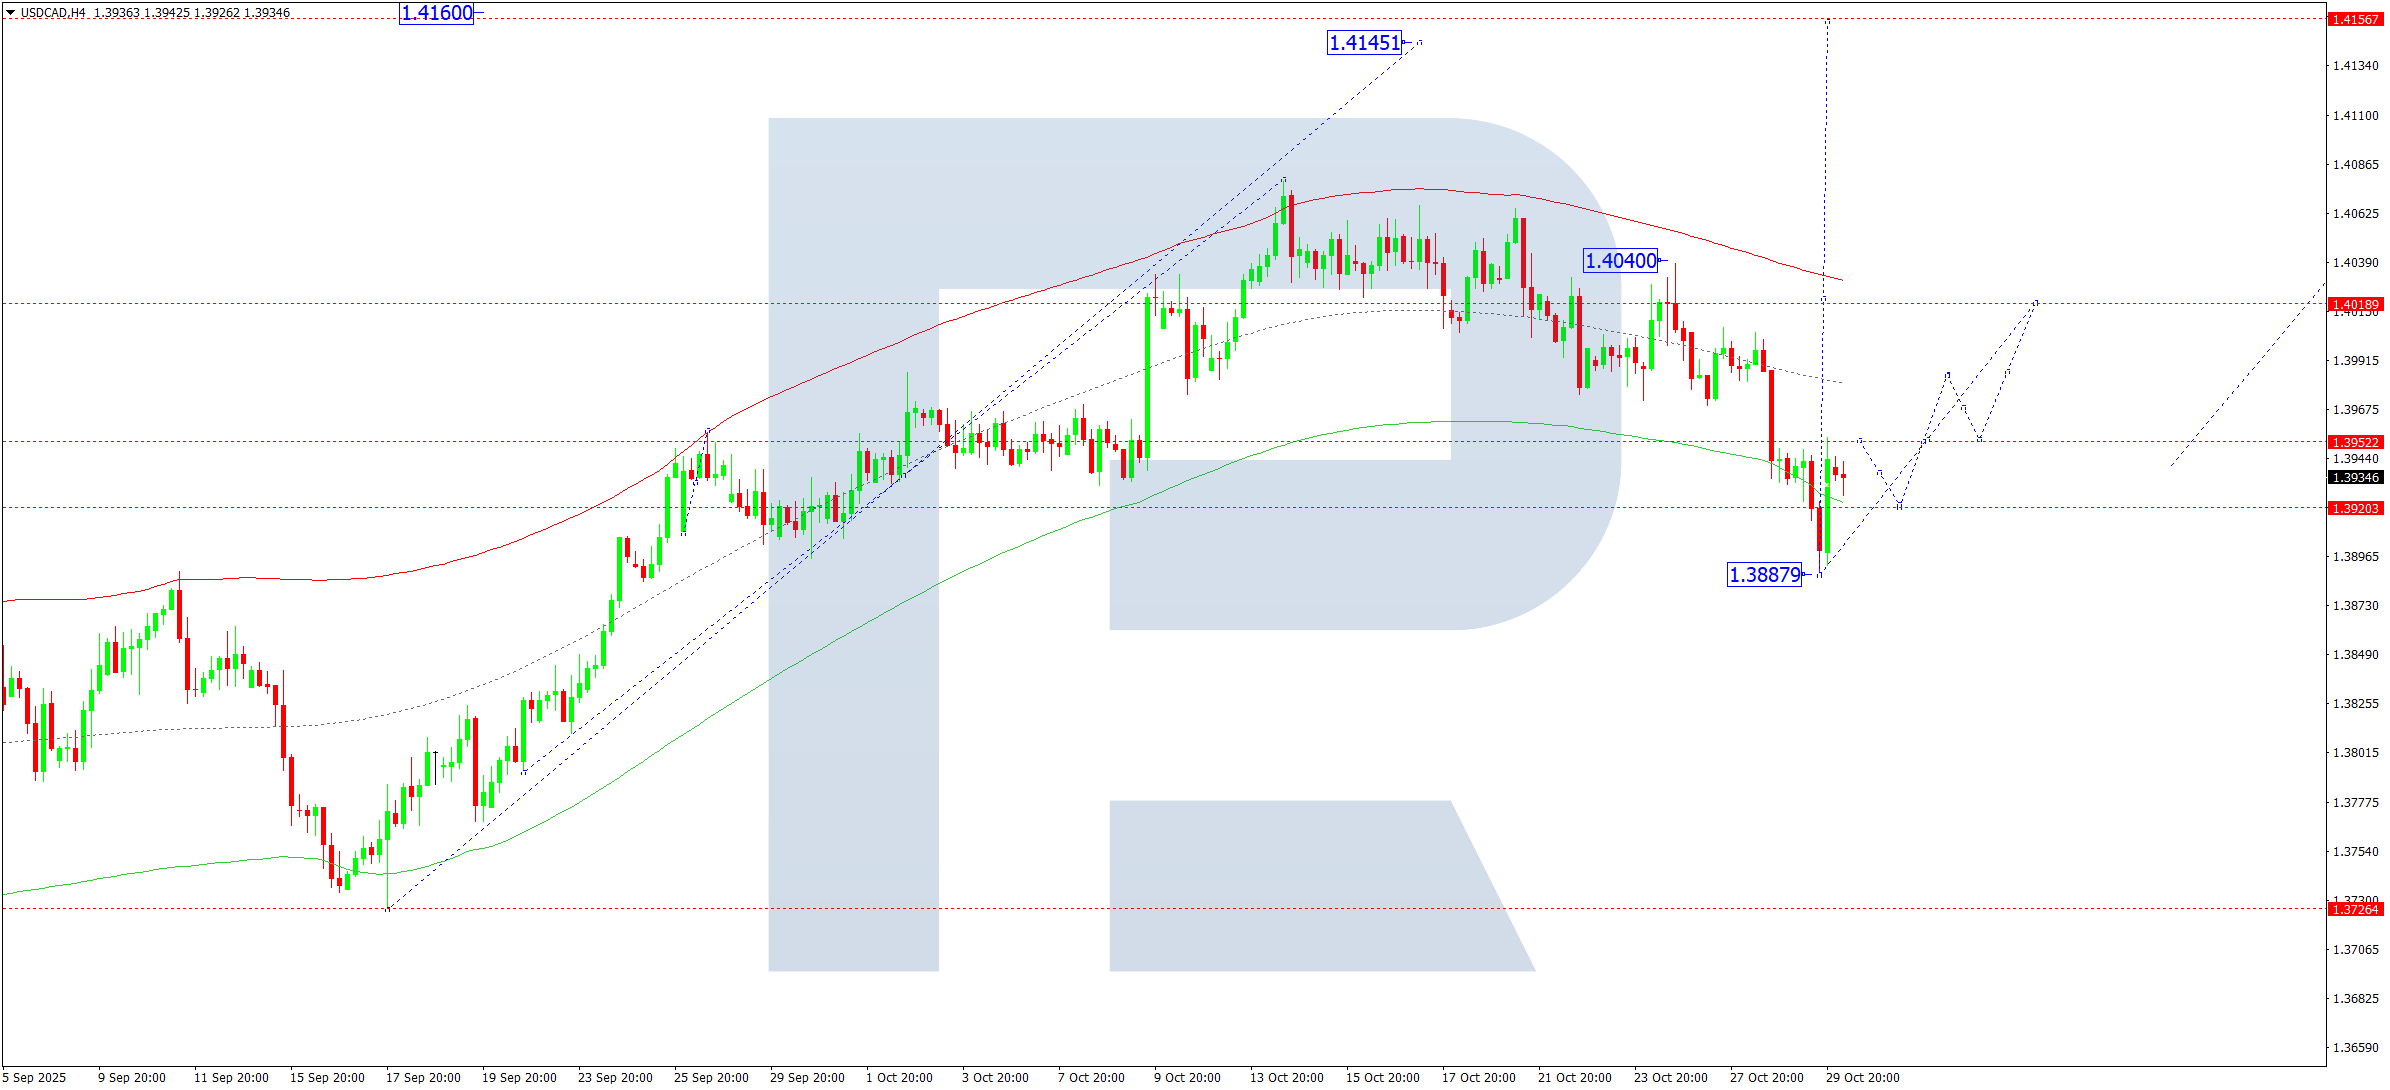
On the H4 chart, USDCAD completed a correction to 1.3888. On 30 October 2025, an upward impulse developed towards 1.3952, followed by an expected correction to 1.3920. The market is likely forming a new consolidation range around this level. A breakout to the upside would open potential for a rise to 1.4020, with prospects of further continuation towards 1.4160 as the local estimated target.
Technically, this scenario is supported by the Elliott Wave structure and the bullish wave matrix with a pivot point at 1.3940, which is key for this wave. The market completed a correction towards the lower boundary of the Price Envelope at 1.3888. A new rise towards 1.4020 is expected, and a breakout above this level could extend the trend towards 1.4160. Later, a correction towards the central line at 1.3930 (testing from above) may follow.
Technical indicators for today’s USDCAD forecast suggest continued growth towards 1.4020 and 1.4160.
XAUUSD forecast
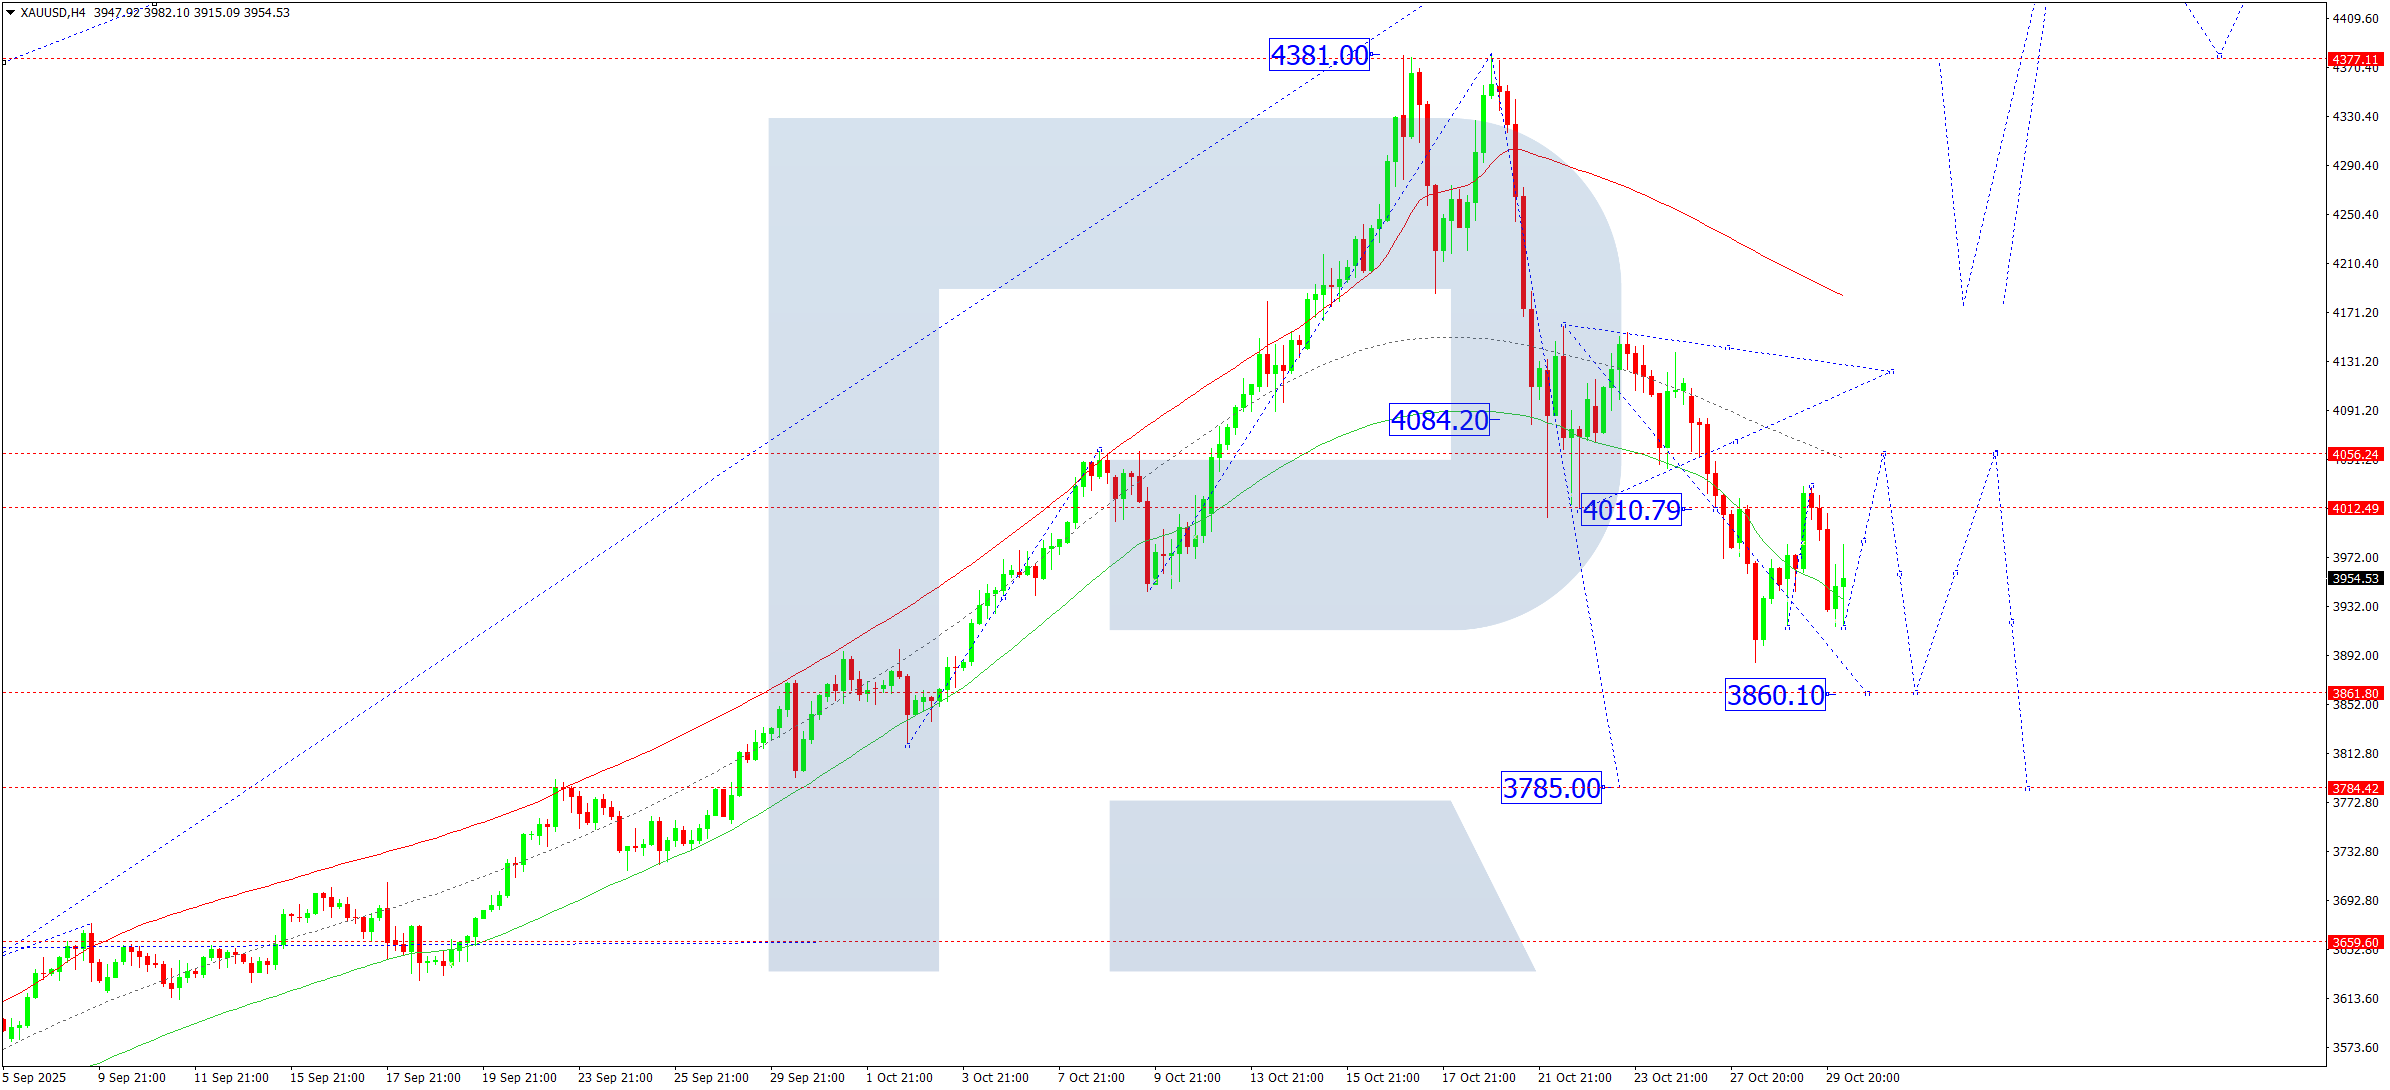
On the H4 chart, XAUUSD is forming a consolidation range around 3,972. On 30 October 2025, the range could expand upwards to 4,056, followed by a decline to 3,860 and a rebound to 4,010. The market is expected to establish a broader consolidation range around 4,010. A breakout downwards would open potential for a continued correction towards 3,785 and possibly further to 3,666. A breakout upwards would open potential for continuation of the trend towards 4,400.
Technically, this scenario is supported by the Elliott Wave structure and the bullish wave matrix with a pivot point at 3,660, which is key for this wave. The market is forming a corrective structure towards the lower boundary of the Price Envelope at 3,860, followed by an expected rebound to 4,010.
Technical indicators for today’s XAUUSD forecast point to a continued correction towards 3,860.
Brent forecast
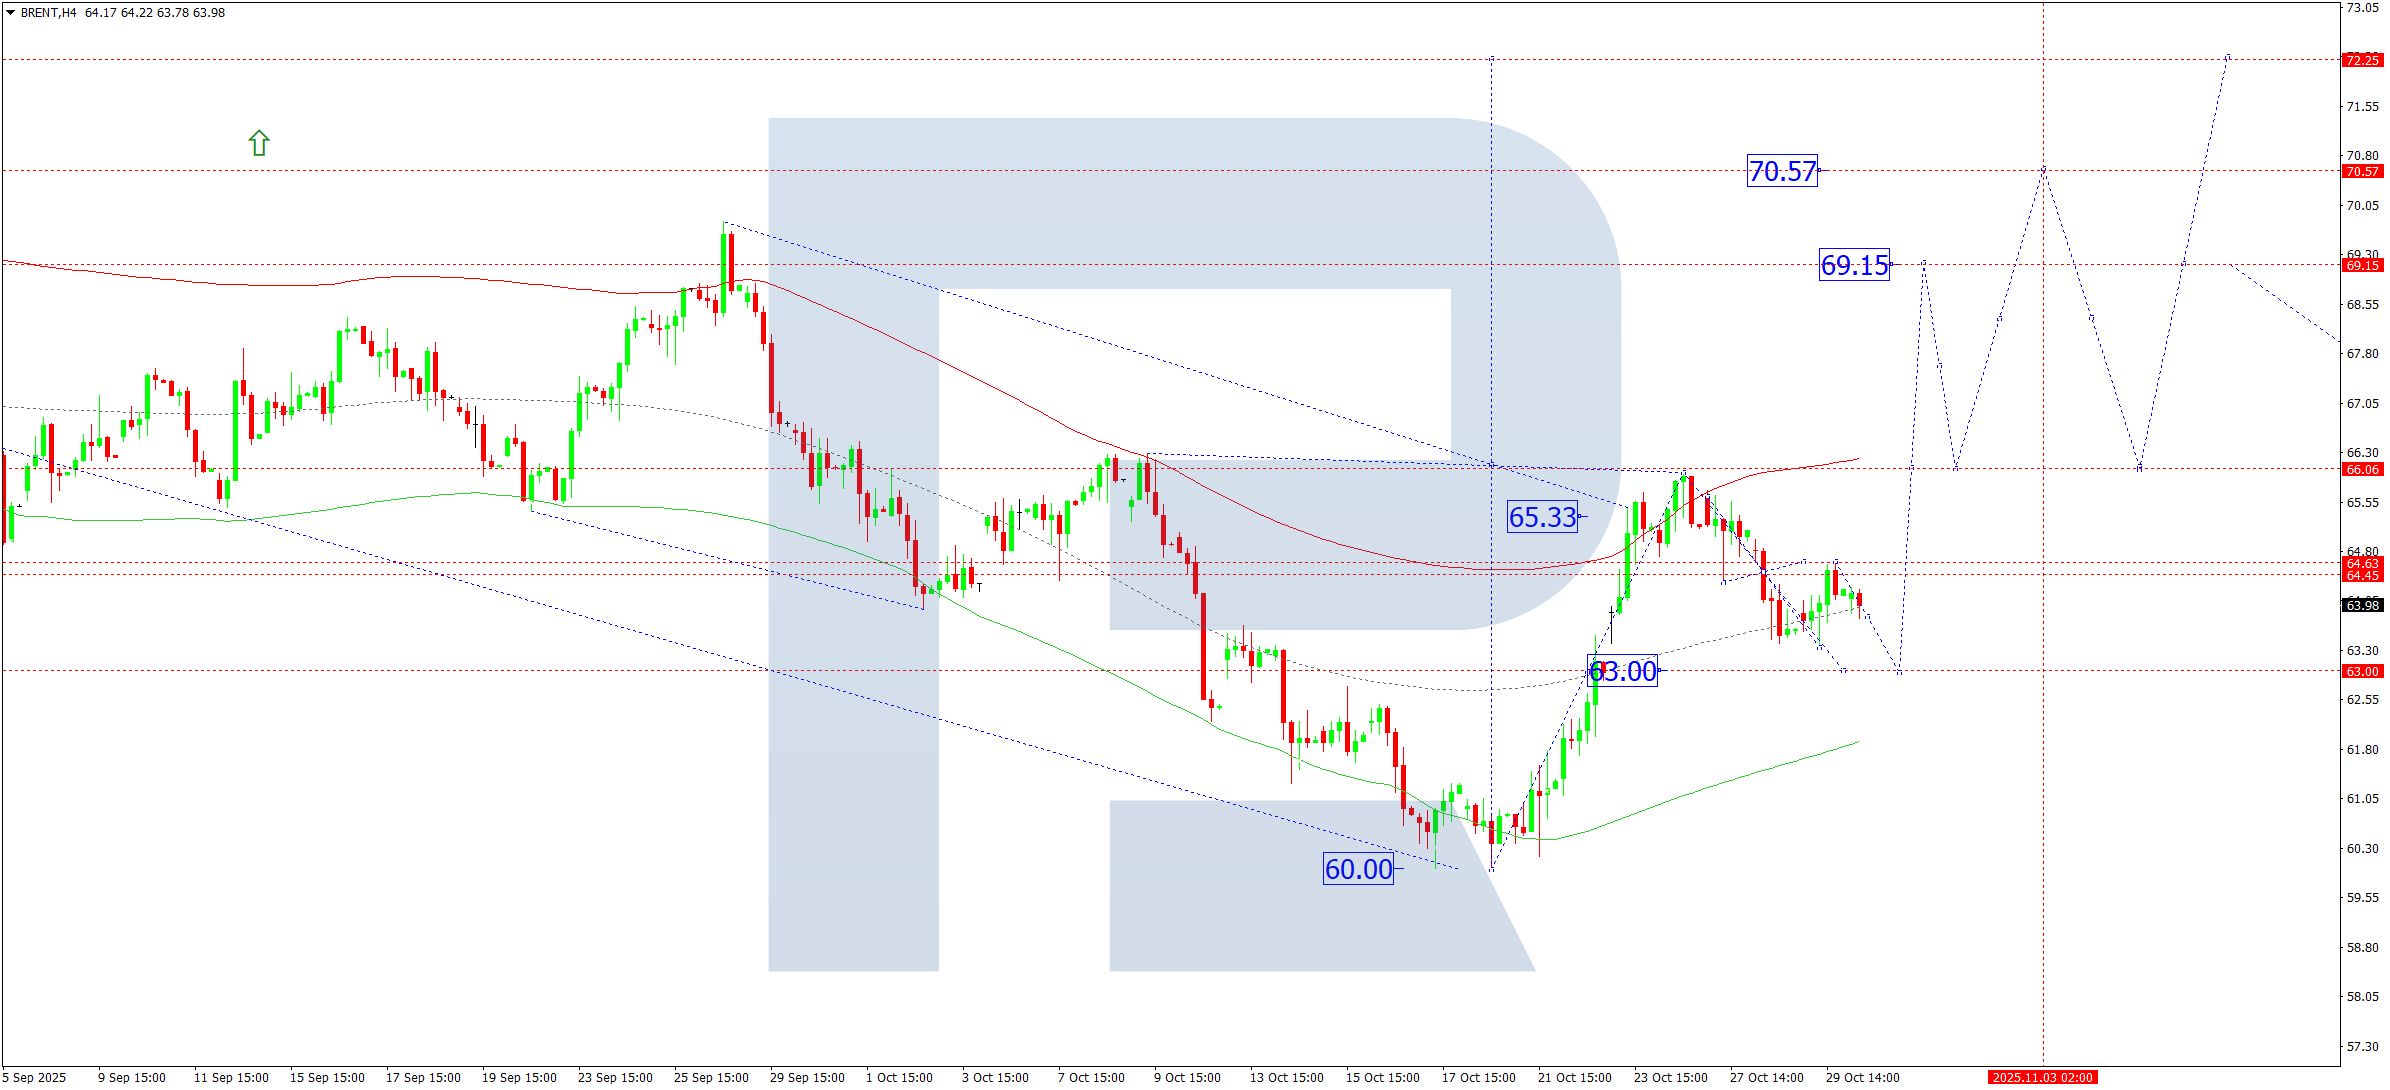
On the H4 chart, Brent crude is forming a corrective structure towards 63.00. On 30 October 2025, completion of this correction is expected, followed by a rise to 66.00. A breakout above this level would open potential for further upside towards 69.15, with prospects of extending the trend towards 70.77 and 72.22.
Technically, this scenario is confirmed by the Elliott Wave structure and the bullish wave matrix with a pivot point at 66.00, which is key in this wave. The market previously reached the upper boundary of the Price Envelope at 65.99 and is now correcting towards its central line at 63.00. Upon completion, an upward impulse towards the upper boundary at 69.15 is expected.
Technical indicators for today’s Brent forecast suggest the completion of the correction near 63.00 and the start of growth towards 66.00 and 69.15.


