Here is a detailed daily technical analysis and forecast for EURUSD, USDJPY, GBPUSD, AUDUSD, USDCAD, XAUUSD, and Brent for 23 April 2025.
EURUSD forecast
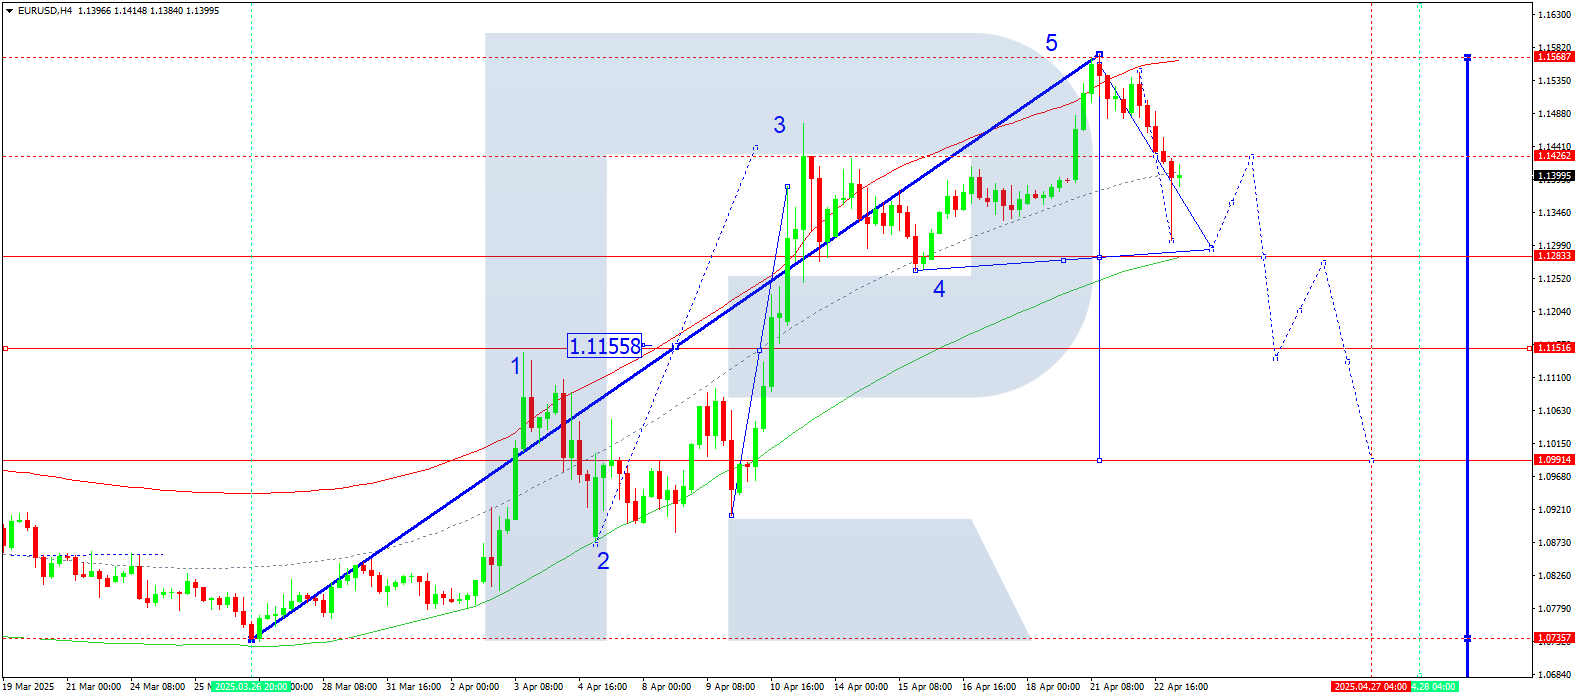
On the H4 chart, EURUSD completed a decline to 1.1307 and corrected to 1.1396. Today, 23 April 2025, the market may decline further to 1.1295. A subsequent correction to 1.1426 is expected, effectively forming a consolidation range around this level. If the price breaks upwards, the wave may extend to 1.1650; if it breaks downwards, it may continue towards 1.1000.
Technically, this scenario is supported by the Elliott wave structure and the growth wave matrix with a pivot at 1.1155, which is key in the current wave. The price previously reached the upper boundary of the price Envelope at 1.1566. A decline towards the lower boundary at 1.1295 remains relevant.
Technical indicators for today’s EURUSD forecast suggest a downward move to 1.1295.

USDJPY forecast
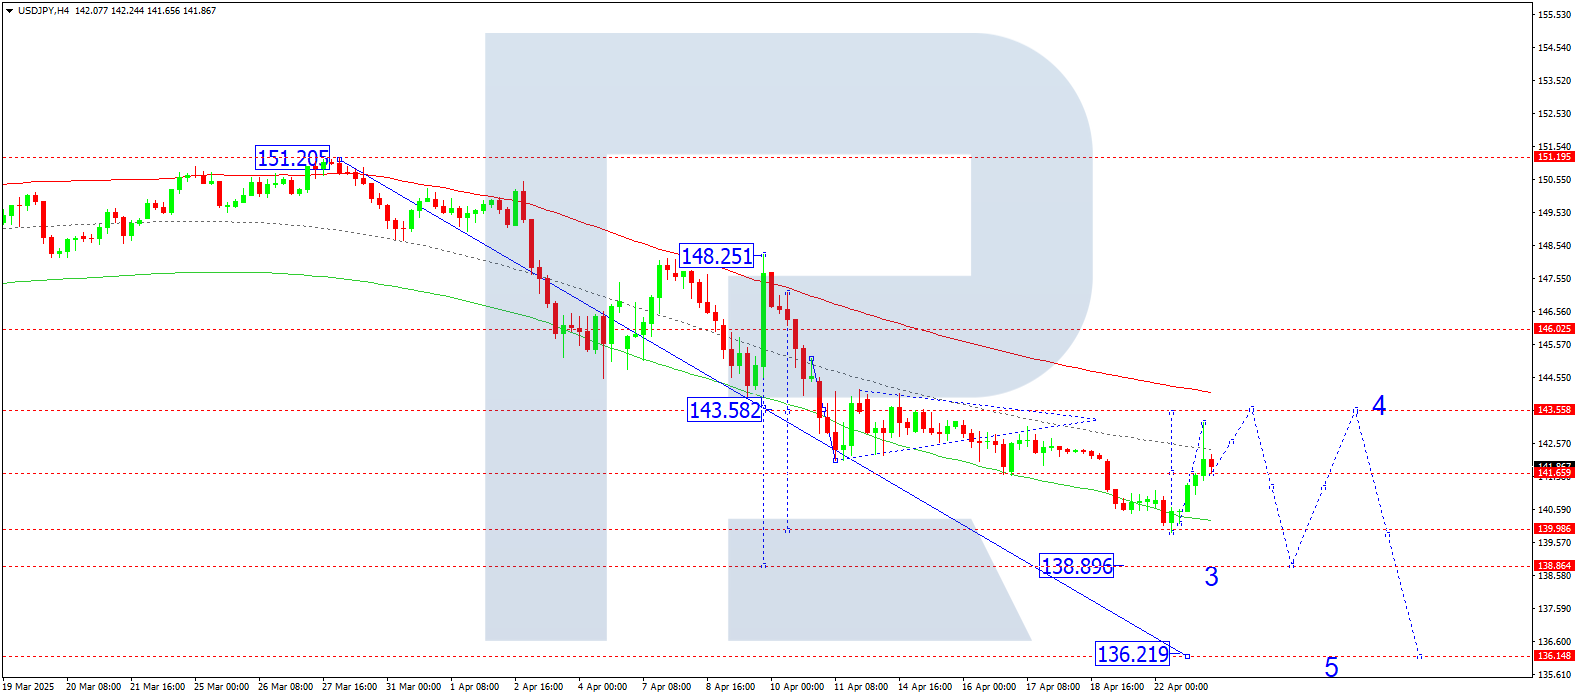
On the H4 chart, USDJPY completed a downward wave to 139.88. Today, 23 April 2025, a correction to 143.55 may follow. Afterwards, the price may decline again to 138.90. A further correction to 146.00 is possible afterwards.
Technically, this scenario is confirmed by the Elliott wave structure and the downward wave matrix with a pivot at 143.55, which is key in this wave. The market reached the lower boundary of the price Envelope at 139.88. A move to the upper boundary at 143.55 is possible, followed by a decline to 138.90.
Technical indicators for today’s USDJPY forecast suggest a growth wave to 143.55.
GBPUSD forecast
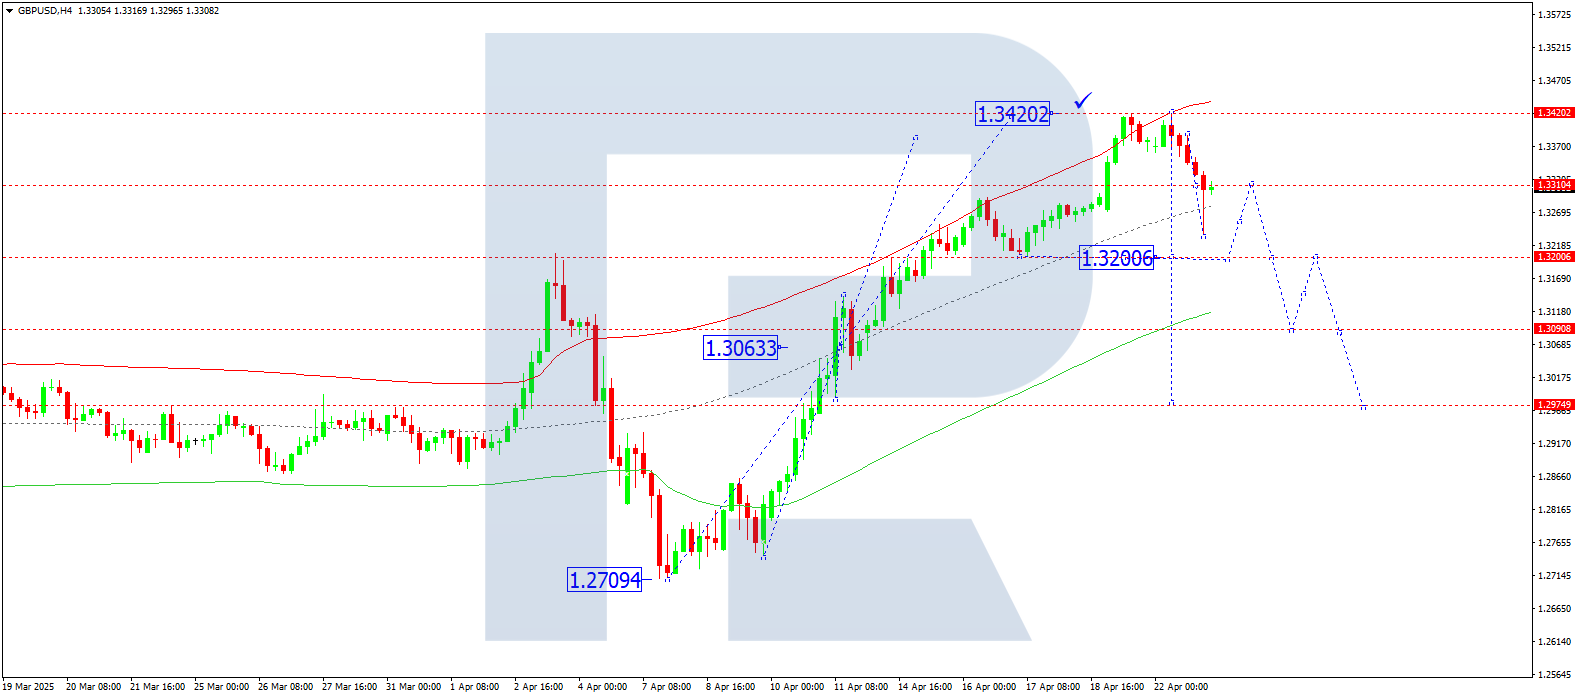
On the H4 chart, GBPUSD declined to 1.3233 and corrected to 1.3310. Today, 23 April 2025, a new downward wave to 1.3200 is possible, followed by a rebound to 1.3310.
Technically, this scenario is supported by the Elliott wave structure and the growth wave matrix with a pivot at 1.3063, which is key in the current wave structure. The market previously reached the upper boundary of the price Envelope at 1.3420. A drop to the lower boundary at 1.3200 remains relevant.
Technical indicators for today’s GBPUSD forecast suggest a decline to 1.3200.
AUDUSD forecast
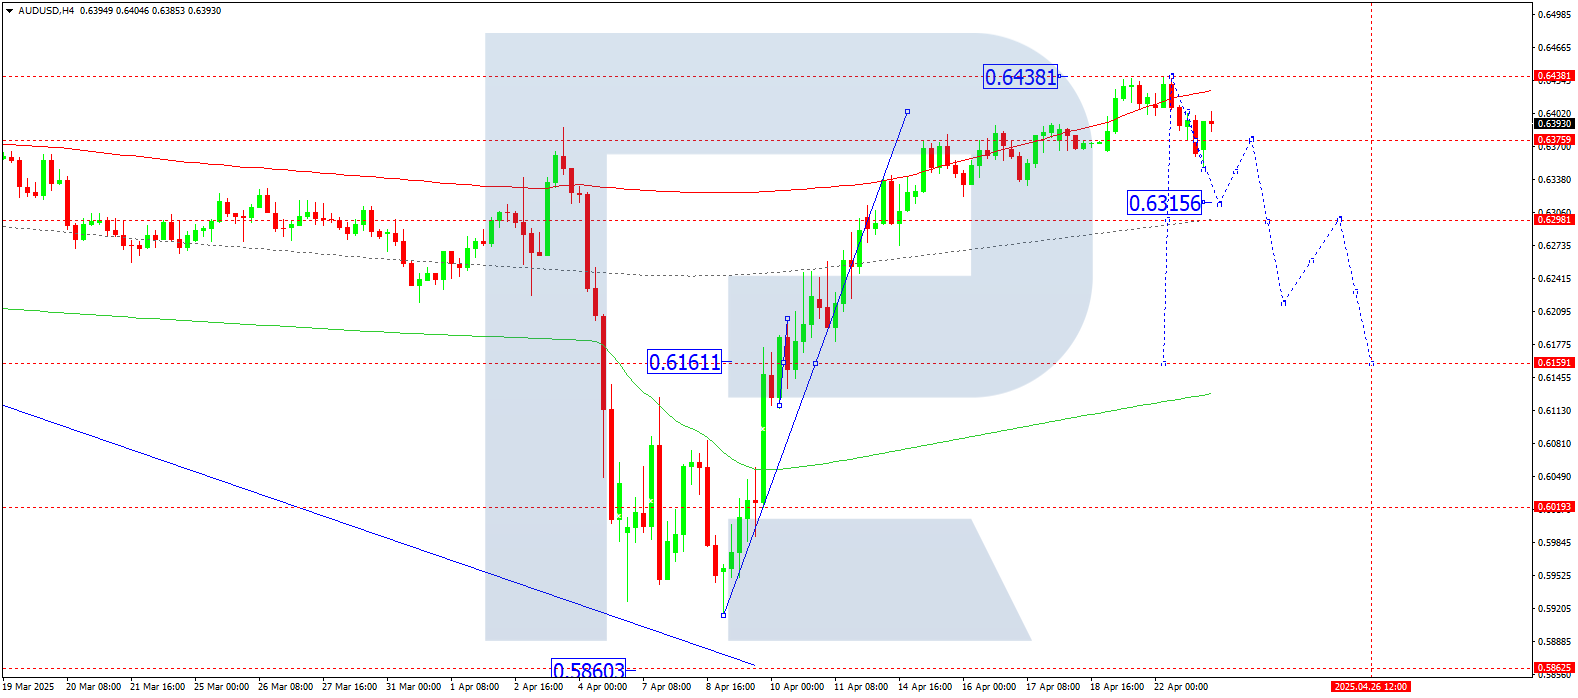
On the H4 chart, AUDUSD is forming a consolidation range around 0.6376. Today, 23 April 2025, a downward breakout could lead to a wave towards 0.6315, with a trend continuation to 0.6160. An upward breakout may initiate a rise to 0.6500.
Technically, the scenario is supported by the Elliott wave structure and the growth wave matrix with a pivot at 0.6161, which is key in this wave. The price previously reached the upper boundary of the price Envelope at 0.6438. A move towards the central line at 0.6315 remains likely.
Technical indicators for today’s AUDUSD forecast suggest a continued decline to 0.6315.
USDCAD forecast
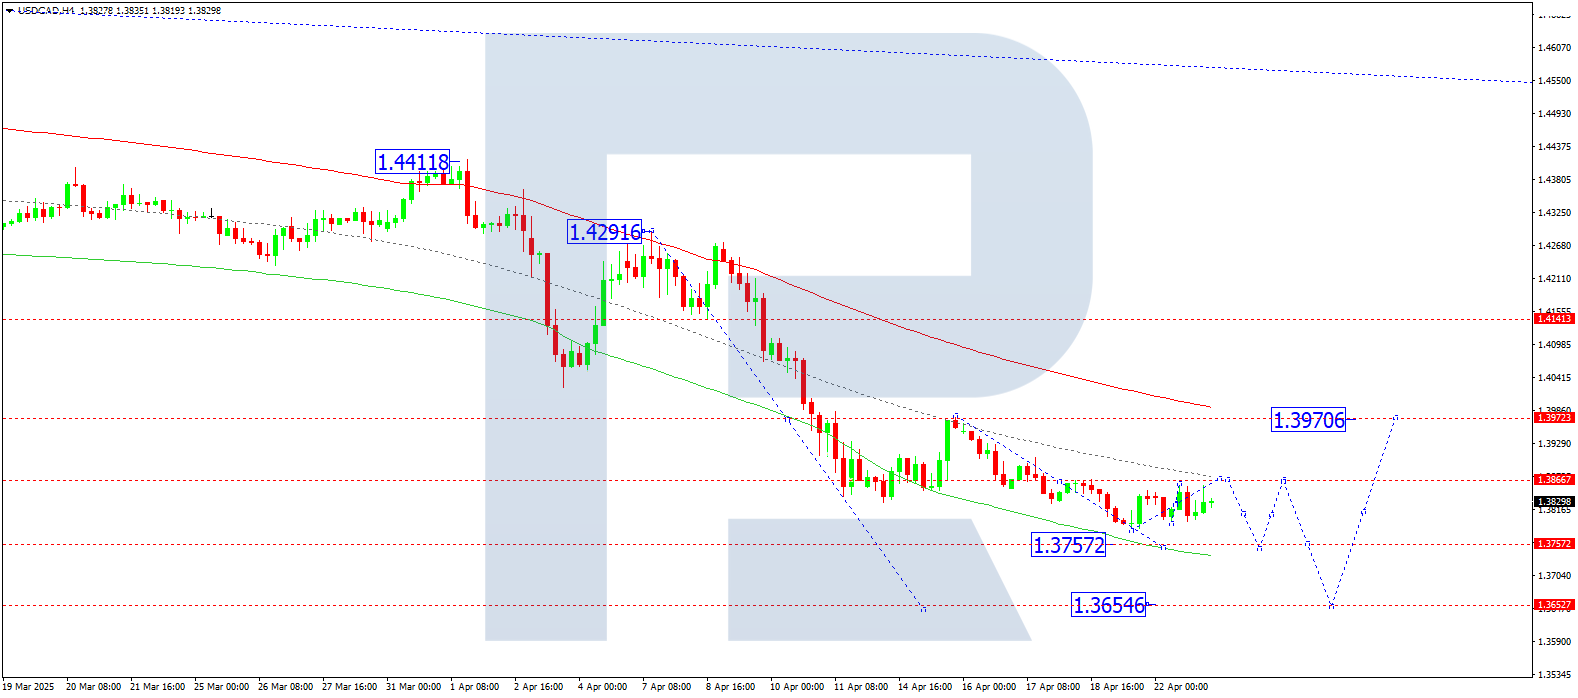
On the H4 chart, USDCAD is developing a growth wave to 1.3866. Today, 23 April 2025, this level may be reached. Afterwards, a downward move to the local target of 1.3757 is possible.
Technically, the scenario is confirmed by the Elliott wave structure and the downward wave matrix with a pivot at 1.3970, considered key for this wave. The market is rising towards the central line of the price Envelope at 1.3866. A drop to the lower boundary at 1.3757 may follow.
Technical indicators for today’s USDCAD forecast suggest a rise to 1.3866.
XAUUSD forecast
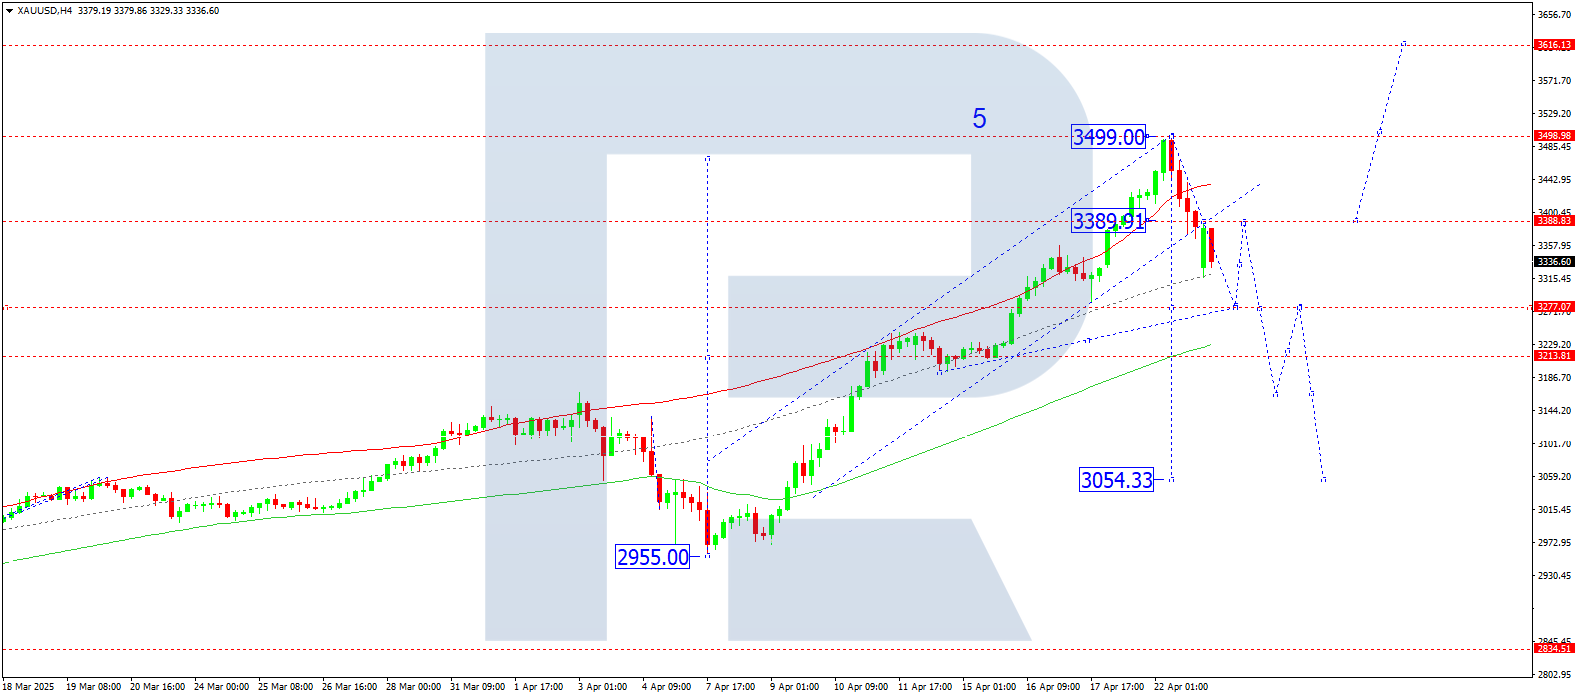
On the H4 chart, XAUUSD broke below 3,389 and continues declining towards 3,277. Today, 23 April 2025, this target may be reached. A rebound to 3,389 (testing from below) may follow. This would define a consolidation range around 3,389. If the price breaks downwards, the trend may continue to 3,055; an upward breakout may push the wave towards 3,616.
Technically, this scenario is supported by the Elliott wave structure and the growth wave matrix with a pivot at 3,213, considered key in this wave. The market previously reached the upper boundary of the price Envelope at 3,499. A decline towards the lower boundary at 3,277 remains likely.
Technical indicators for today’s XAUUSD forecast suggest a downward wave to 3,277.
Brent forecast
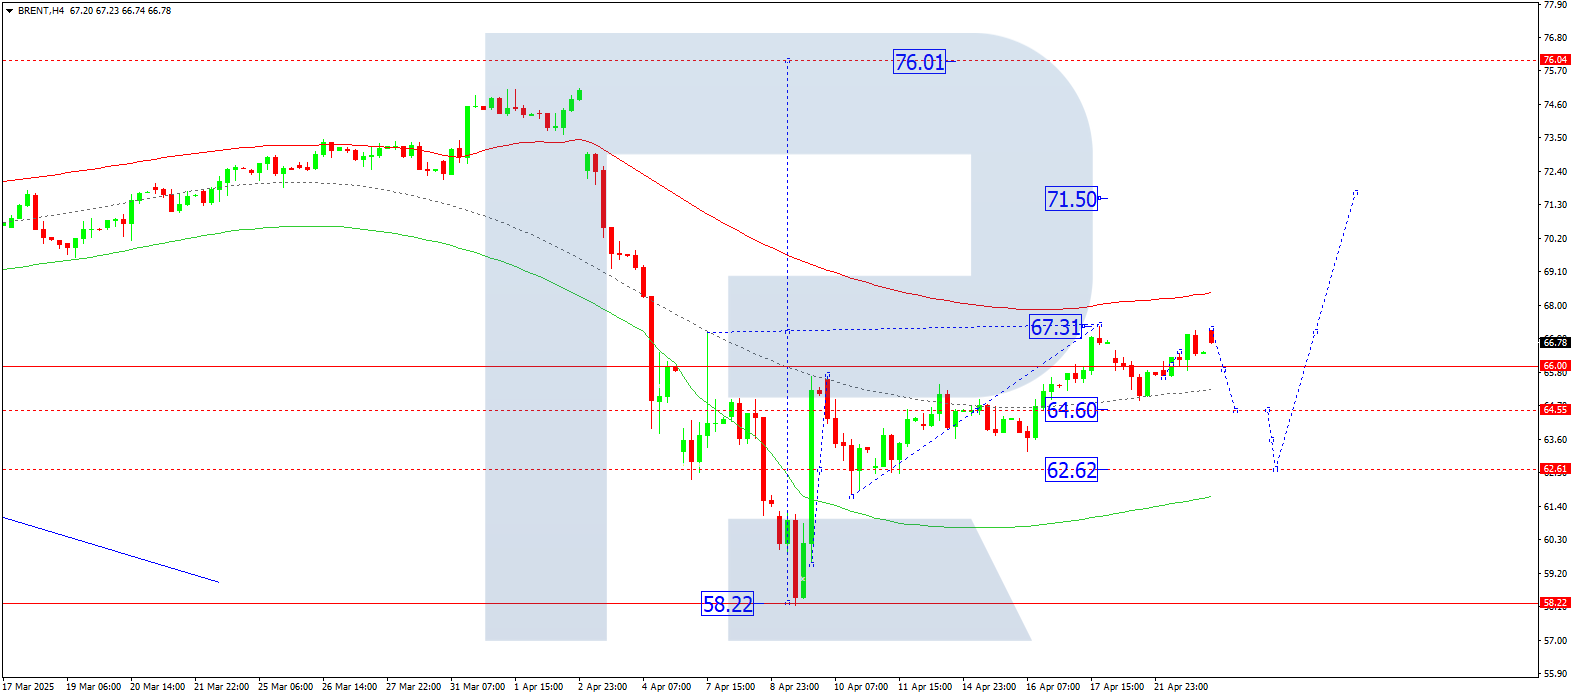
On the H4 chart, Brent completed a growth wave to 67.23. A consolidation range is forming around 66.00. Today, 23 April 2025, a correction to 64.60 is possible. If the price breaks this level, the wave may continue down to 62.62. An upward breakout would suggest a continuation to 71.50, the local projected target.
Technically, this scenario is confirmed by the Elliott wave structure and the downward wave matrix with a pivot at 67.00. This level is considered crucial in the current wave for Brent. The market reached the upper boundary of the price Envelope at 67.38. A correction to the central line at 64.60 remains likely.
Technical indicators in today’s Brent forecast suggest a corrective move to 64.60.