Here is a detailed daily technical analysis and forecast for EURUSD, USDJPY, GBPUSD, AUDUSD, USDCAD, XAUUSD, and Brent for 24 April 2025.
EURUSD forecast
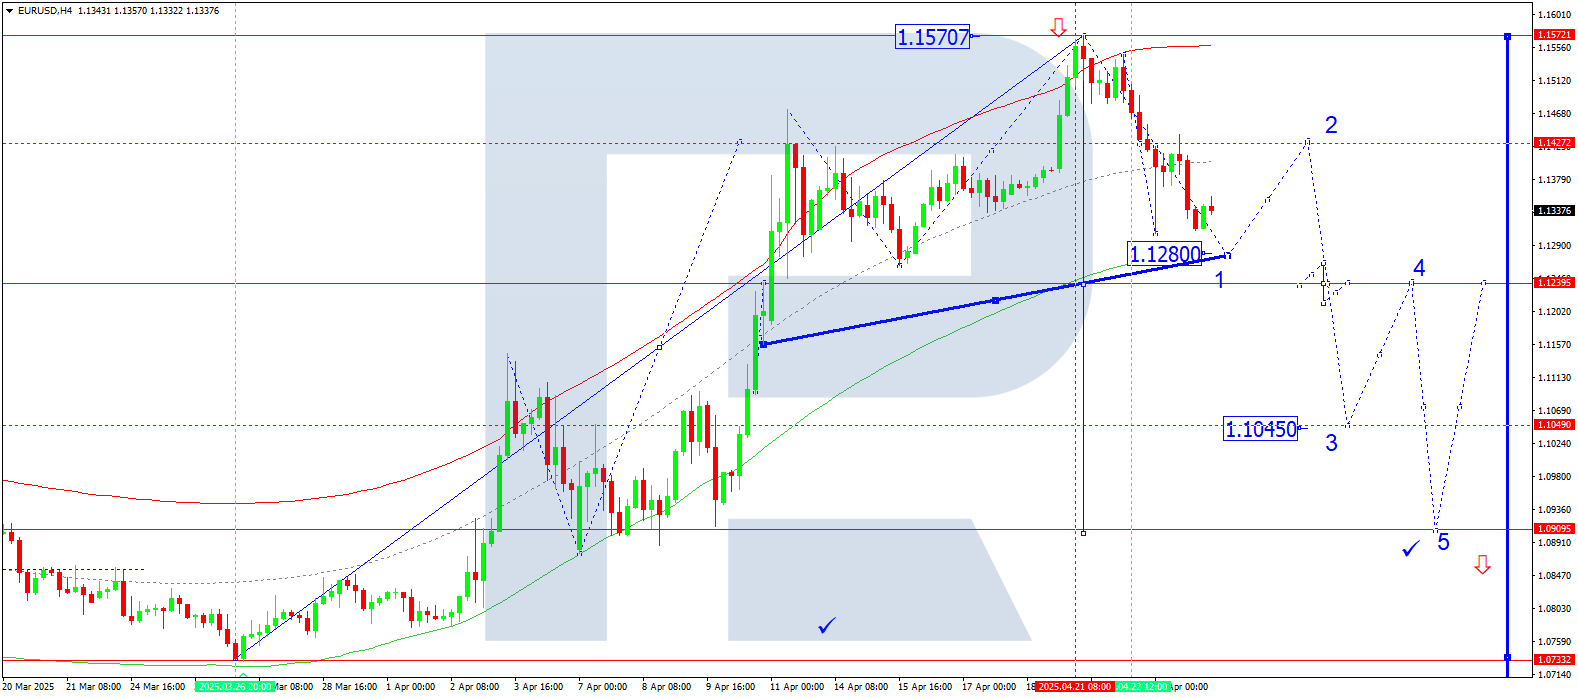
On the H4 chart, EURUSD continues to develop a downward wave towards 1.1280. Today, 24 April 2025, this target may be reached, followed by a correction to 1.1427. Afterwards, the price may resume its decline towards 1.1240, with a potential continuation of the trend to 1.1045, the local target.
Technically, this scenario is confirmed by the Elliott wave structure and the downward wave matrix with a pivot at 1.1427, which is crucial in this wave structure. The current wave is forming towards the lower boundary of the price Envelope at 1.1280.
Technical indicators for today’s EURUSD forecast suggest a decline to 1.1280.

USDJPY forecast
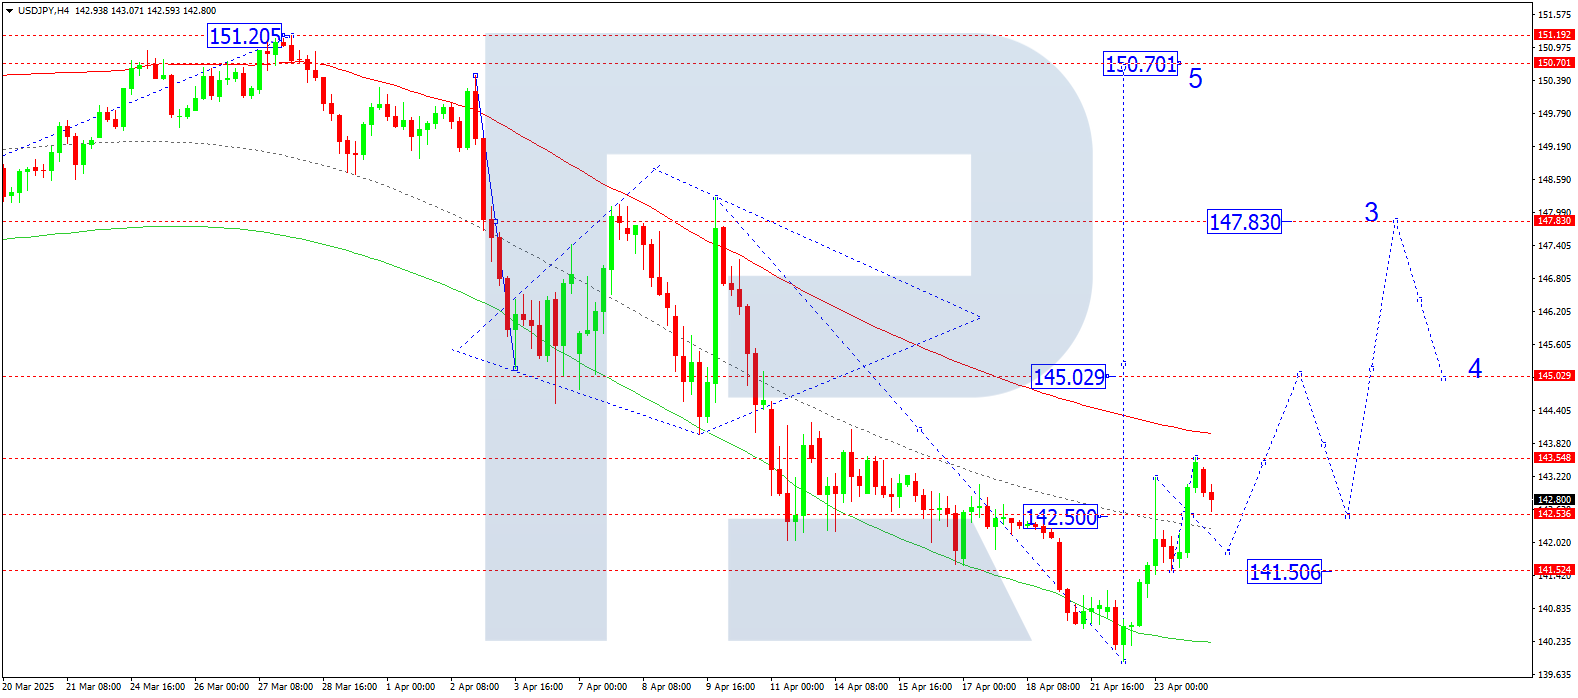
On the H4 chart, USDJPY completed a growth wave to 143.56. Today, 24 April 2025, a correction to 142.50 is expected, with a possible continuation to 141.50. Then, a new upward wave to 145.00 may begin, potentially extending to 147.83.
Technically, this scenario is supported by the Elliott wave structure and the growth wave matrix with a pivot at 141.50. This level is key in the current structure. The market has reached the central line of the price Envelope and is forming a consolidation range around 142.50. A rise to the upper boundary at 145.00 is possible, followed by a move back to the central line at 142.50.
Technical indicators for today’s USDJPY forecast suggest a correction to 141.50.
GBPUSD forecast
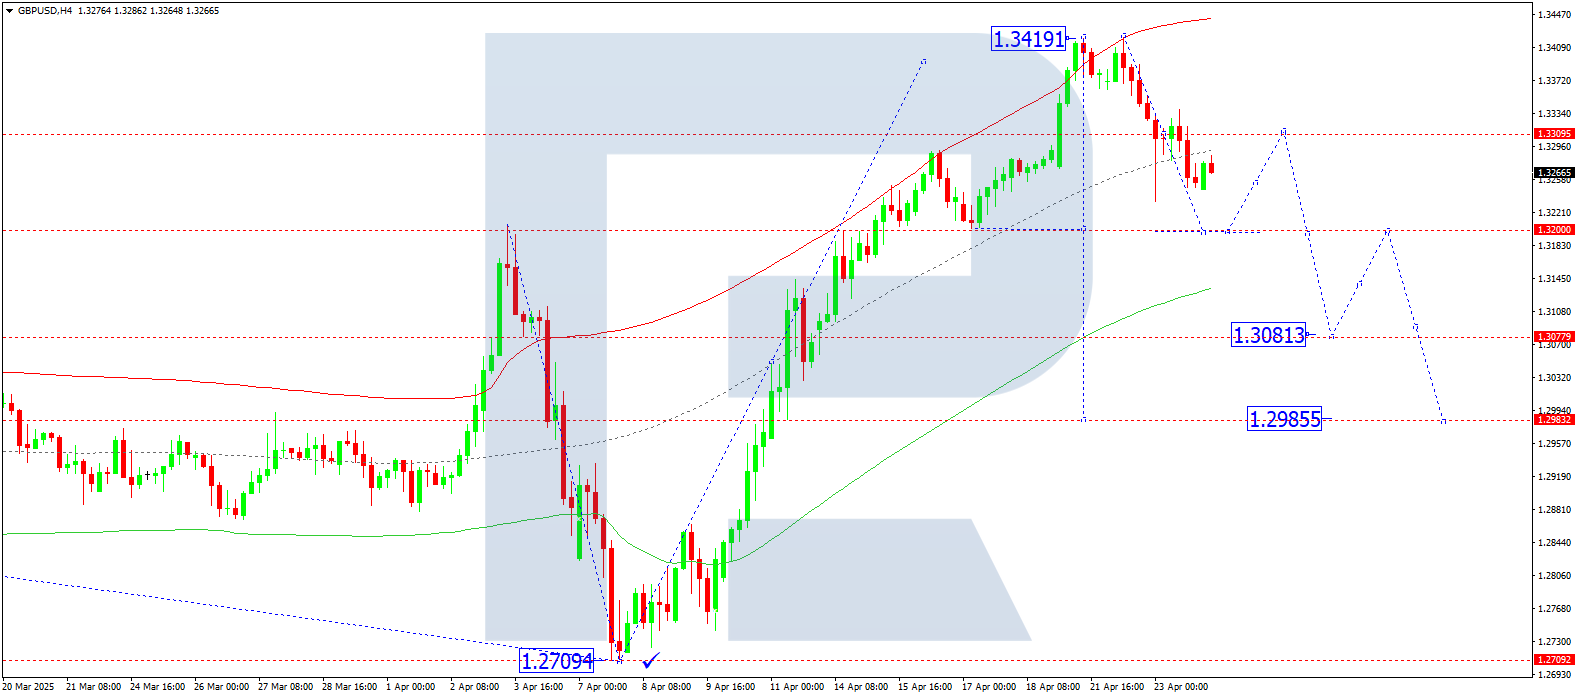
On the H4 chart, GBPUSD continues to decline towards 1.3200. Today, 24 April 2025, this target may be reached, followed by a short-term correction to 1.3300, and then a further decline to 1.3080.
Technically, the scenario is confirmed by the Elliott wave structure and the downward wave matrix with a pivot at 1.3300, which is key in this wave. The price is moving towards the lower boundary of the price Envelope at 1.3200, with a correction to the central line at 1.3300 expected afterwards.
Technical indicators for today’s GBPUSD forecast suggest a decline to 1.3200.
AUDUSD forecast
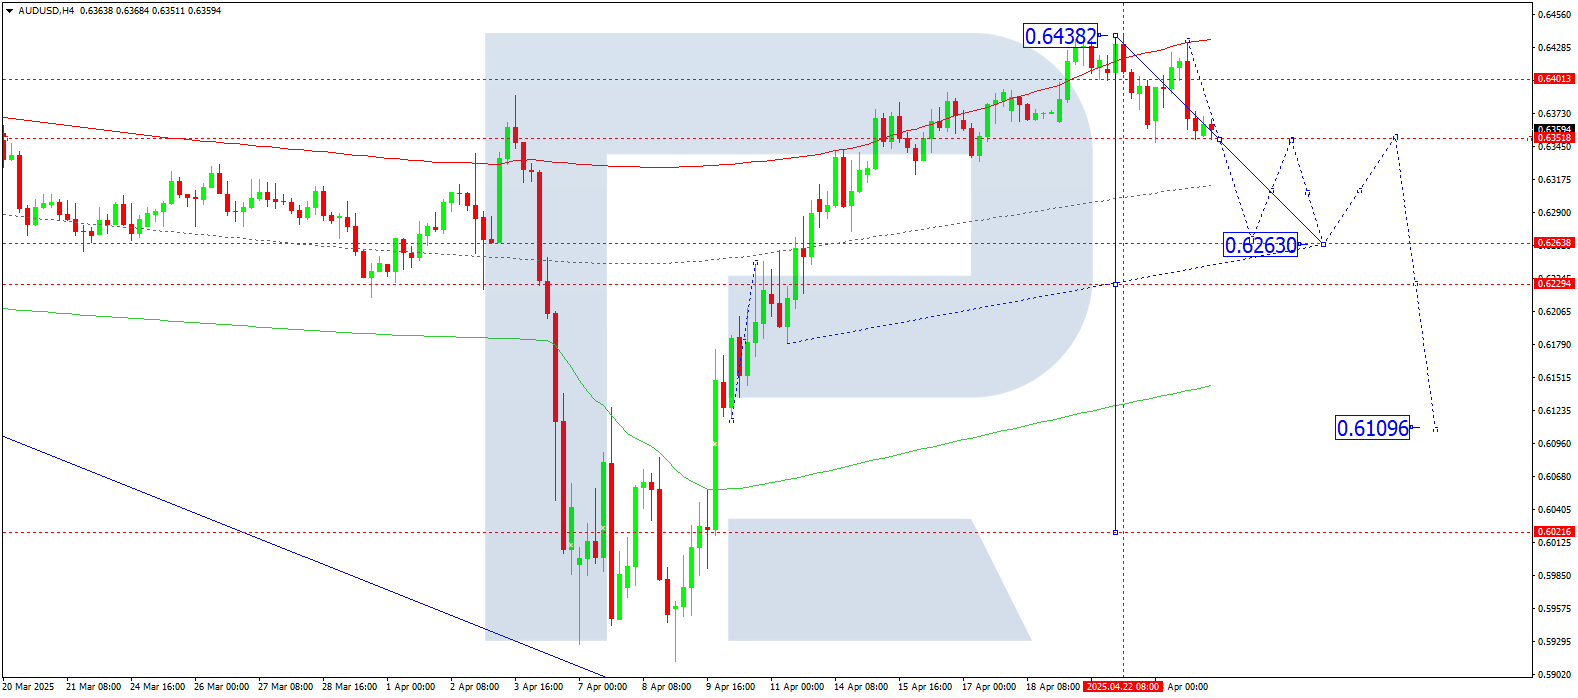
On the H4 chart, AUDUSD is consolidating around 0.6400. Today, 24 April 2025, a downward breakout towards the local target of 0.6270 is likely. A correction to 0.6355 (testing from below) may follow, then a continuation of the trend to 0.6262, the first target.
Technically, this scenario is confirmed by the Elliott wave structure and the growth wave matrix with a pivot at 0.6161, which is key in this wave. The market had previously completed a wave to the upper boundary of the price Envelope at 0.6438. A decline to the central line at 0.6262 may follow.
Technical indicators for today’s AUDUSD forecast suggest a continuation of the downward wave to 0.6262.
USDCAD forecast
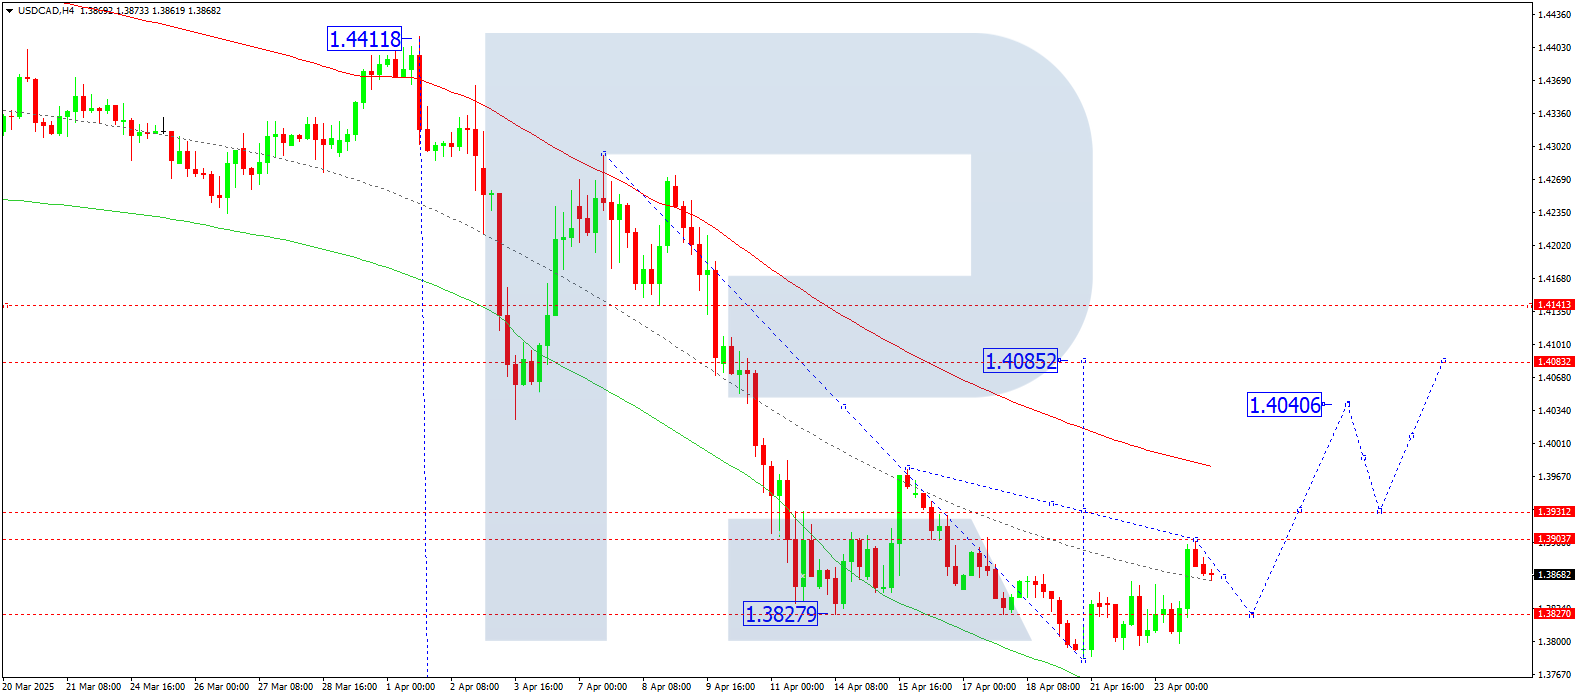
On the H4 chart, USDCAD completed a growth wave to 1.3903. Today, 24 April 2025, a decline towards 1.3827 is expected. Afterwards, a new upward wave to the local target of 1.4040 may begin.
Technically, the Elliott wave structure and the downward wave matrix with a pivot at 1.4080 support this scenario. This level is crucial in the current structure. The market completed a wave to the central line of the price Envelope at 1.3903. A decline to the lower boundary at 1.3827 is anticipated.
Technical indicators for today’s USDCAD forecast suggest a downward wave to 1.3827.
XAUUSD forecast
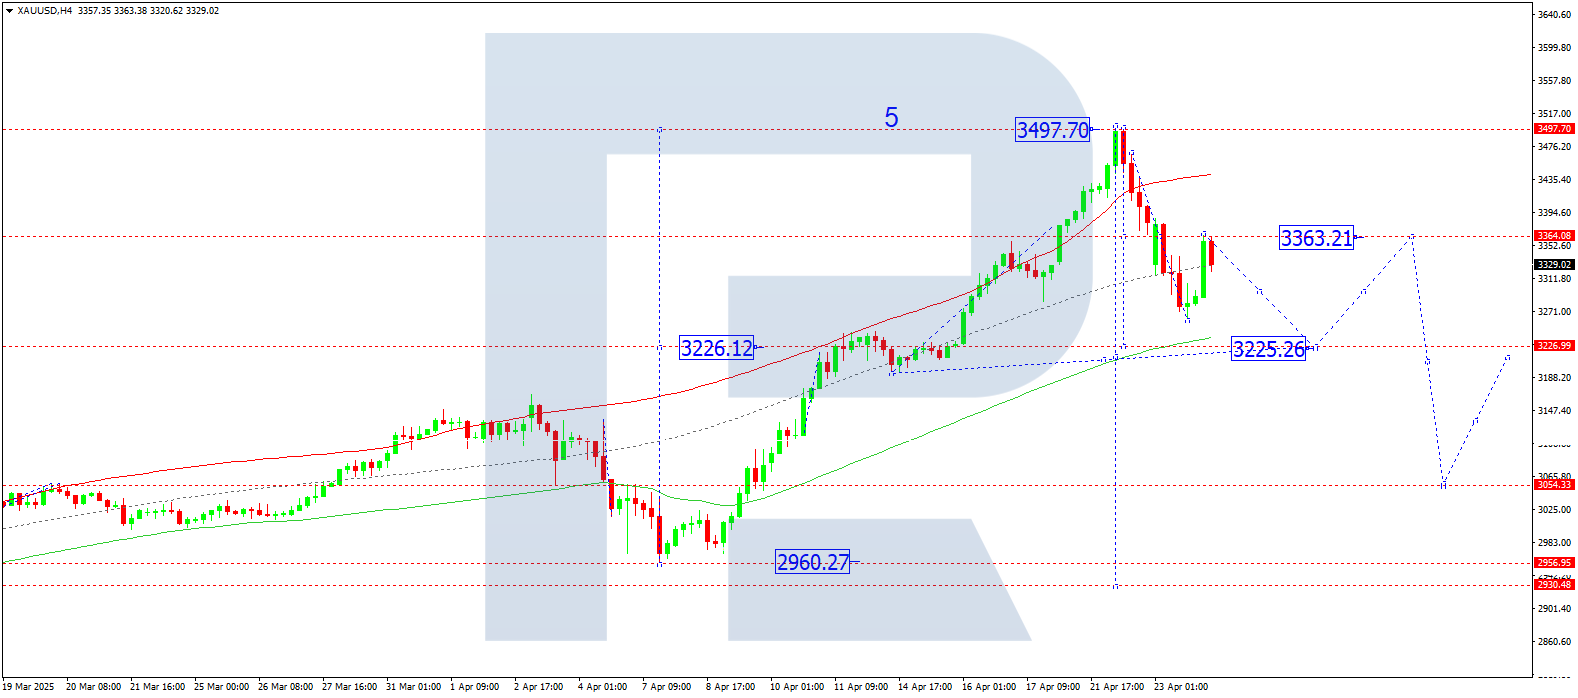
On the H4 chart, XAUUSD completed a wave to 3,260 and corrected to 3,363. Today, 24 April 2025, the price may decline to 3,225, the first target. After reaching this level, a rebound towards 3,363 (testing from below) is possible.
Technically, this scenario is supported by the Elliott wave structure and the downward wave matrix with a pivot at 3,363, which is key in the current wave. The market is forming a wave towards the lower boundary of the price Envelope at 3,225. A potential correction towards the central line at 3,363 may follow.
Technical indicators for today’s XAUUSD forecast suggest a decline to 3,225.
Brent forecast
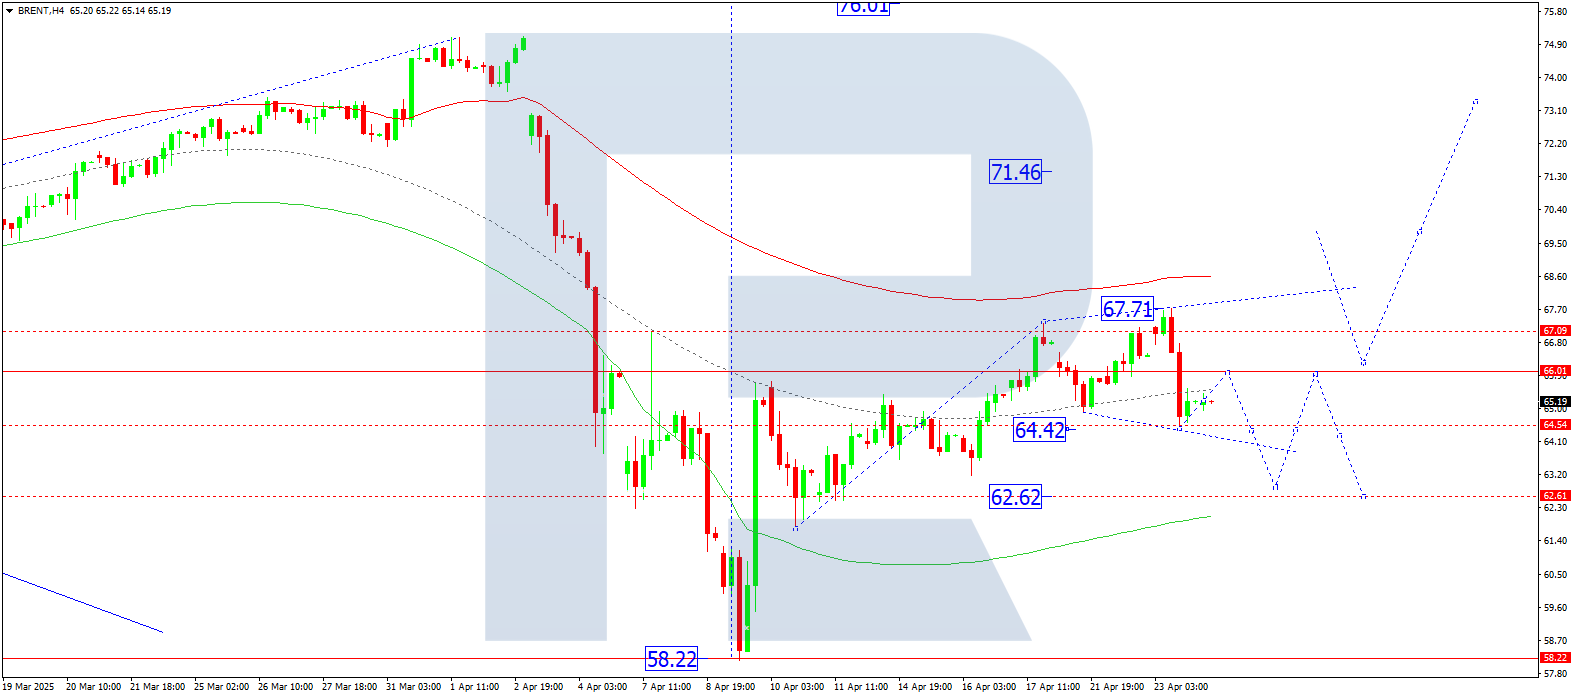
On the H4 chart, Brent is forming a wide consolidation range around 66.00, having recently extended the range up to 67.70 and down to 64.44. Today, 24 April 2025, a rise to 66.00 (testing from below) is possible. If the price breaks below the range, the wave may extend to 62.62, which will be considered a correction to the previous growth wave. If the price breaks upwards, a rise to the local target of 71.50 may follow.
Technically, the scenario is supported by the Elliott wave structure and the growth wave matrix with a pivot at 62.62, which is key for the current Brent wave. The market previously completed a wave to the upper boundary of the price Envelope at 67.71. A correction to the lower boundary at 62.62 remains relevant.
Technical indicators for today’s Brent forecast suggest a correction to 62.62.