Here is a detailed daily technical analysis and forecast for EURUSD, USDJPY, GBPUSD, AUDUSD, USDCAD, XAUUSD, and Brent for 31 March 2025.
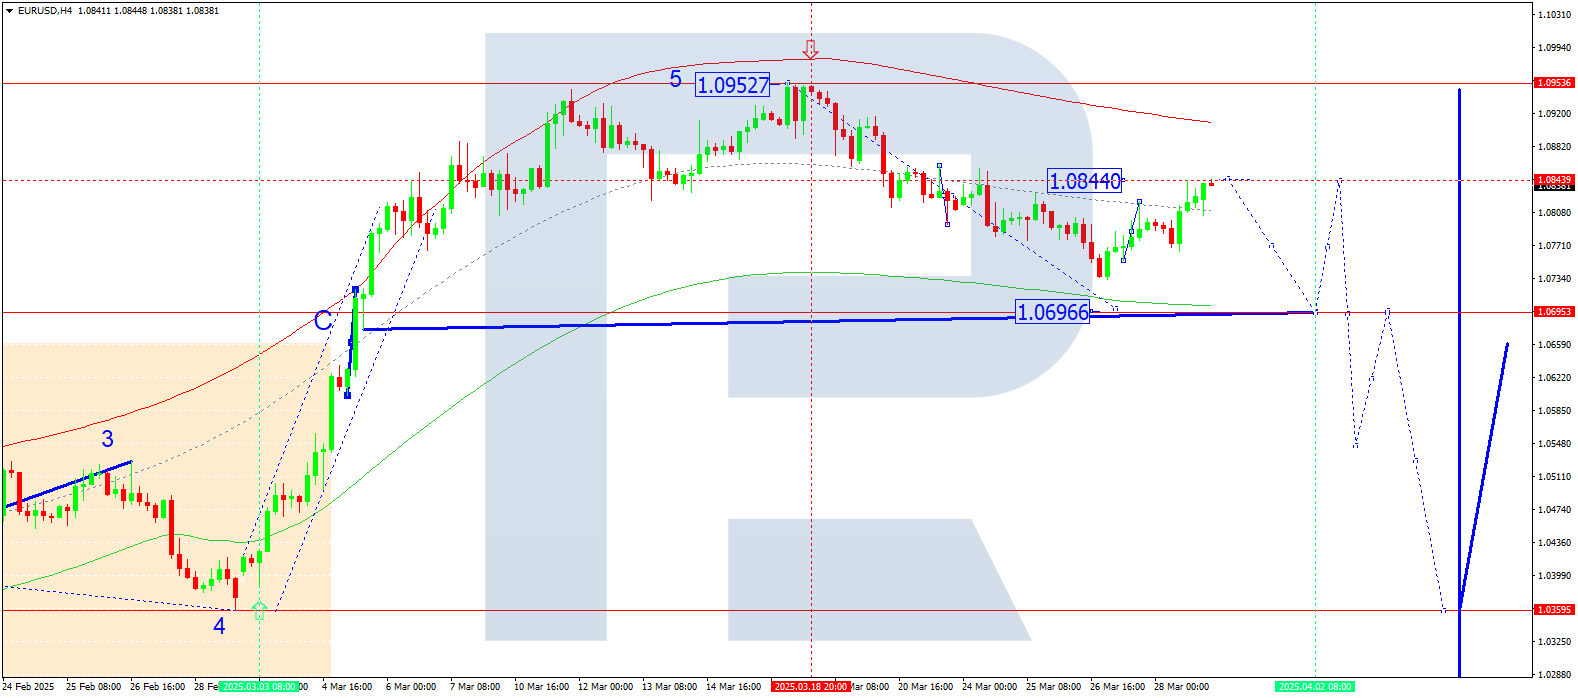
EURUSD forecast
On the H4 chart of EURUSD, the market completed a correction to the 1.0844 level. Today, 31 March 2025, a downward wave towards 1.0696 is possible — this is the first target. After reaching this level, another correction wave to 1.0825 may follow. Once it completes, a new downward wave may develop to 1.0555 — this is the local target.
Technically, this scenario is confirmed by the Elliott wave structure and the decline wave matrix centred at 1.0825, which is considered key for EURUSD. A downward movement to the lower boundary of the Price Envelope at 1.0696 is expected today.
Technical indicators for today’s EURUSD forecast suggest a possible continuation of the downward wave towards 1.0696.

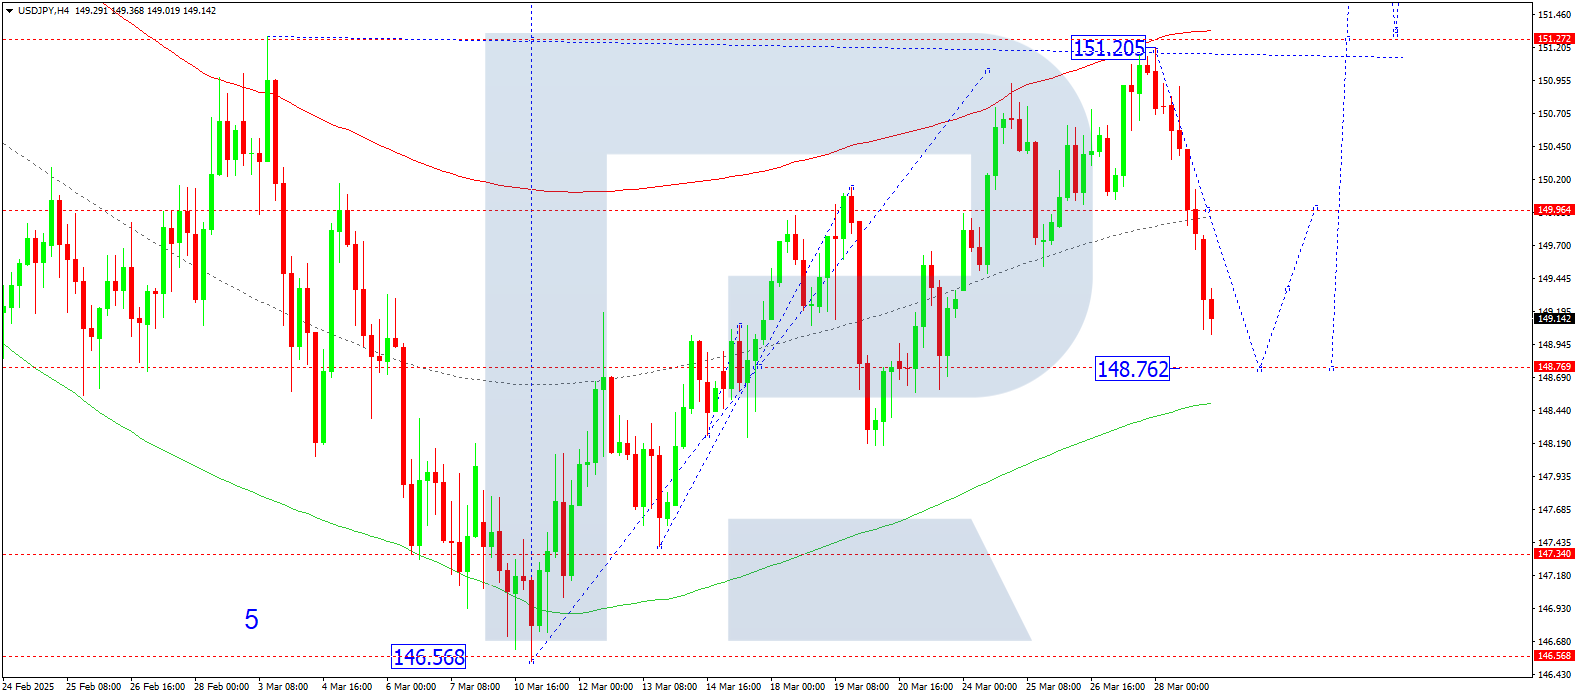
USDJPY forecast
On the H4 chart of USDJPY, the market is forming a downward wave towards 148.76. Today, 31 March 2025, this target may be reached. Then a wave towards 149.95 could follow. This forms a possible consolidation range between these levels. A breakout upwards could open potential for a wave towards 151.30, while a breakout downwards may lead to 147.34.
Technically, this scenario is confirmed by the Elliott wave structure and the growth wave matrix with a pivot at 148.76. The market is currently forming a correction wave to the lower boundary of the Price Envelope at 148.72. Afterwards, a move towards the upper boundary at 151.30 may follow.
Technical indicators for today’s USDJPY forecast suggest a correction wave towards 148.76.
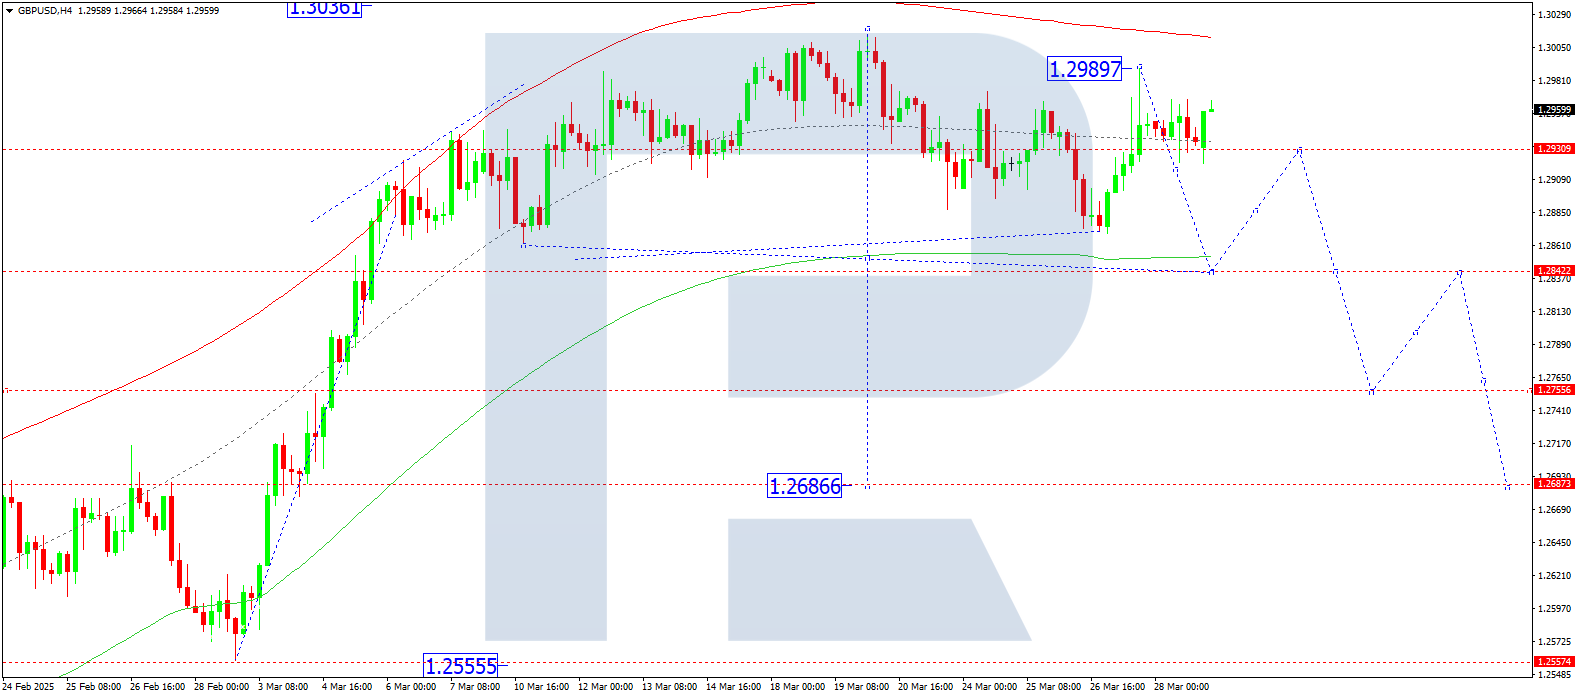
GBPUSD forecast
On the H4 chart of GBPUSD, the market continues to form a consolidation range around 1.2930. Today, 31 March 2025, this range may expand downward to 1.2842. Once this level is reached, a rise back to 1.2930 (retest from below) is possible. Afterward, a downward wave may develop towards 1.2755 — this is the local target.
Technically, the scenario is confirmed by the Elliott wave structure and the decline wave matrix centred at 1.2930. The market is forming a consolidation range around this level. A move towards the lower boundary of the Price Envelope at 1.2842 is expected, followed by a rise to the central line at 1.2930.
Technical indicators for today’s GBPUSD forecast suggest a move down to 1.2842.
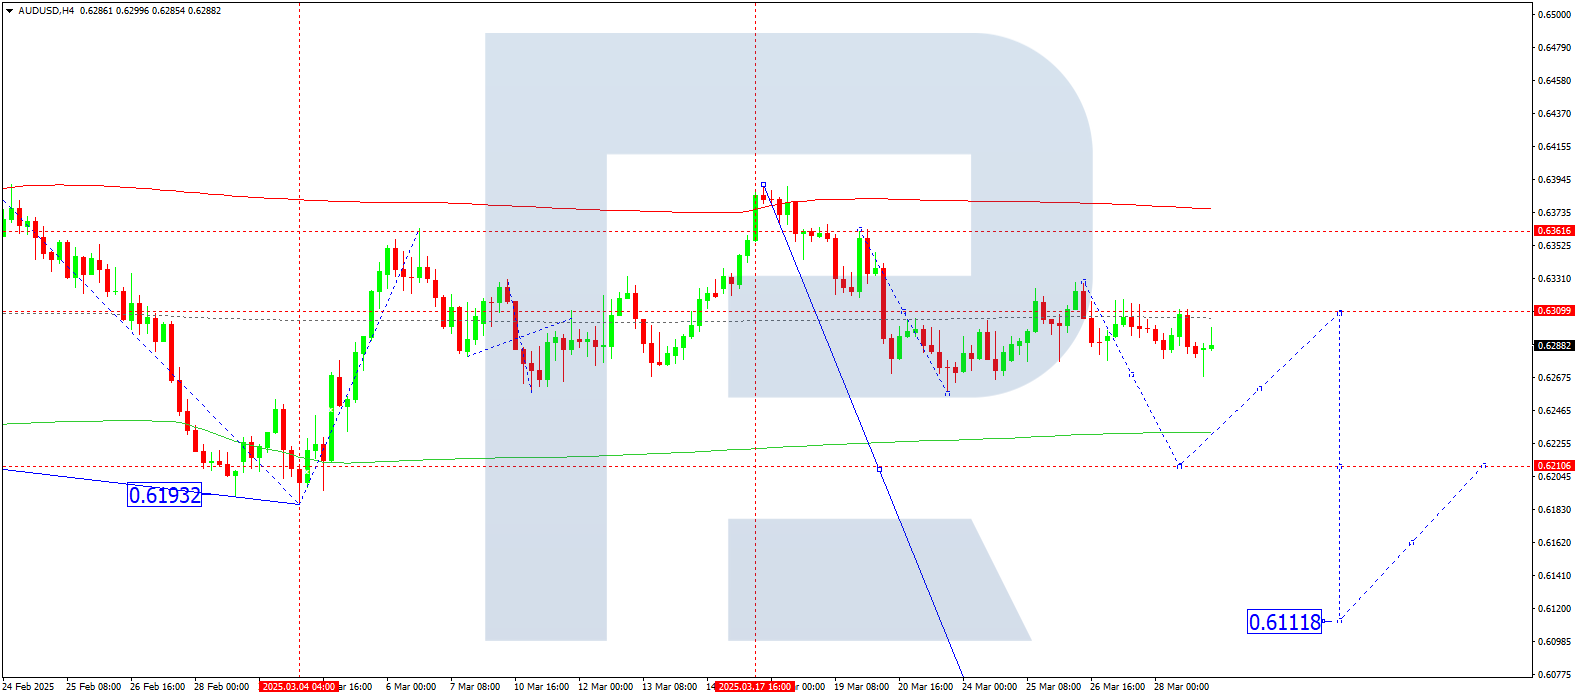
AUDUSD forecast
On the H4 chart of AUDUSD, the market is forming a downward wave structure towards 0.6210. Today, 31 March 2025, this target is likely to be reached. A breakout below this level may open the way for a continuation of the wave to 0.6100 — this is the local target.
Technically, the scenario is confirmed by the Elliott wave structure and the decline wave matrix centred at 0.6300. The market is forming a consolidation range around the central line of the Price Envelope — 0.6300. A continued decline to the lower boundary at 0.6210 is expected.
Technical indicators for today’s AUDUSD forecast suggest a continued downward move to 0.6210.
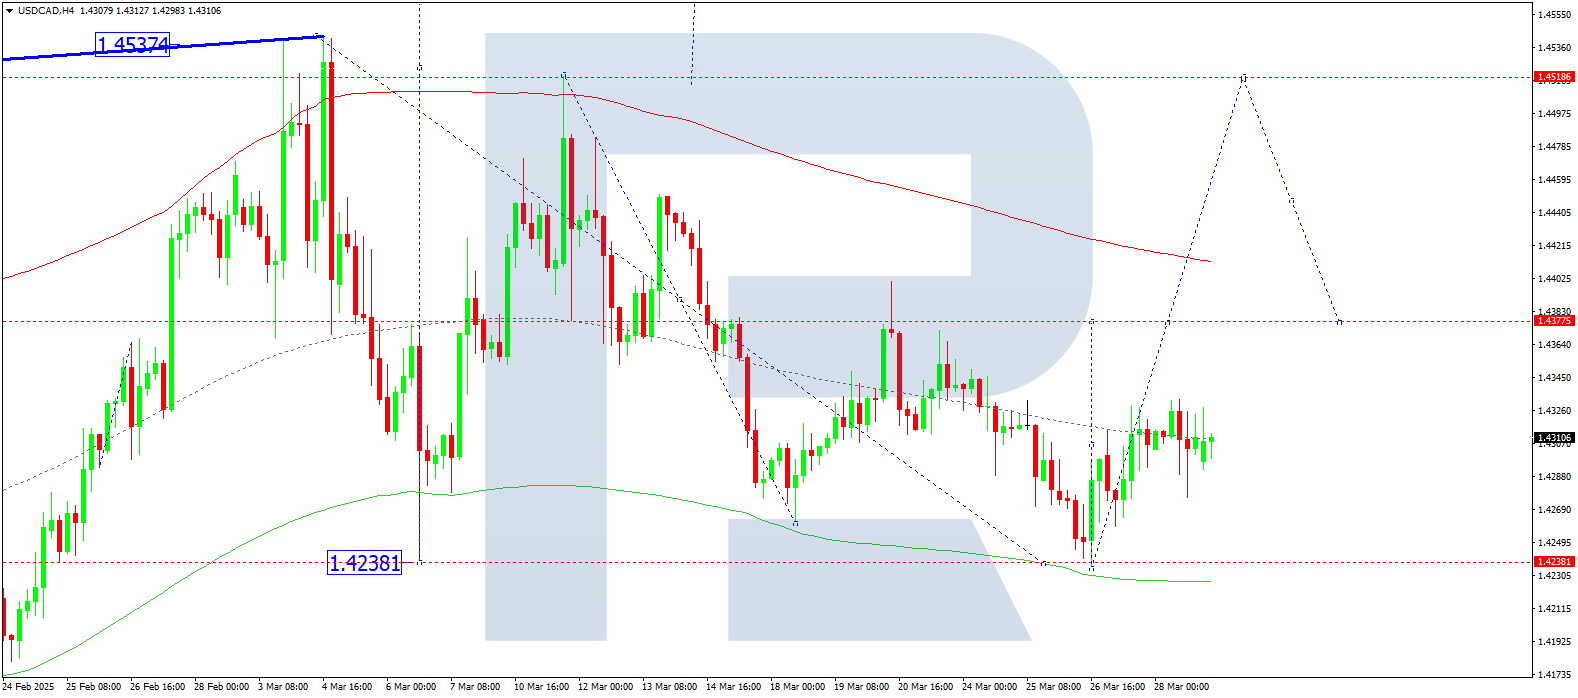
USDCAD forecast
On the H4 chart of USDCAD, the market is forming a growth wave structure towards 1.4380. Today, 31 March 2025, this target is expected to be reached. Afterwards, a correction wave to 1.4300 may follow.
Technically, this scenario is confirmed by the Elliott wave structure and the decline wave matrix centred at 1.4380. It is considered key to the current wave structure. At the moment, the market is heading towards the upper boundary of the Price Envelope at 1.4380. Later, a decline to the central line at 1.4300 is likely.
Technical indicators for today’s USDCAD forecast suggest an upward move to 1.4380.
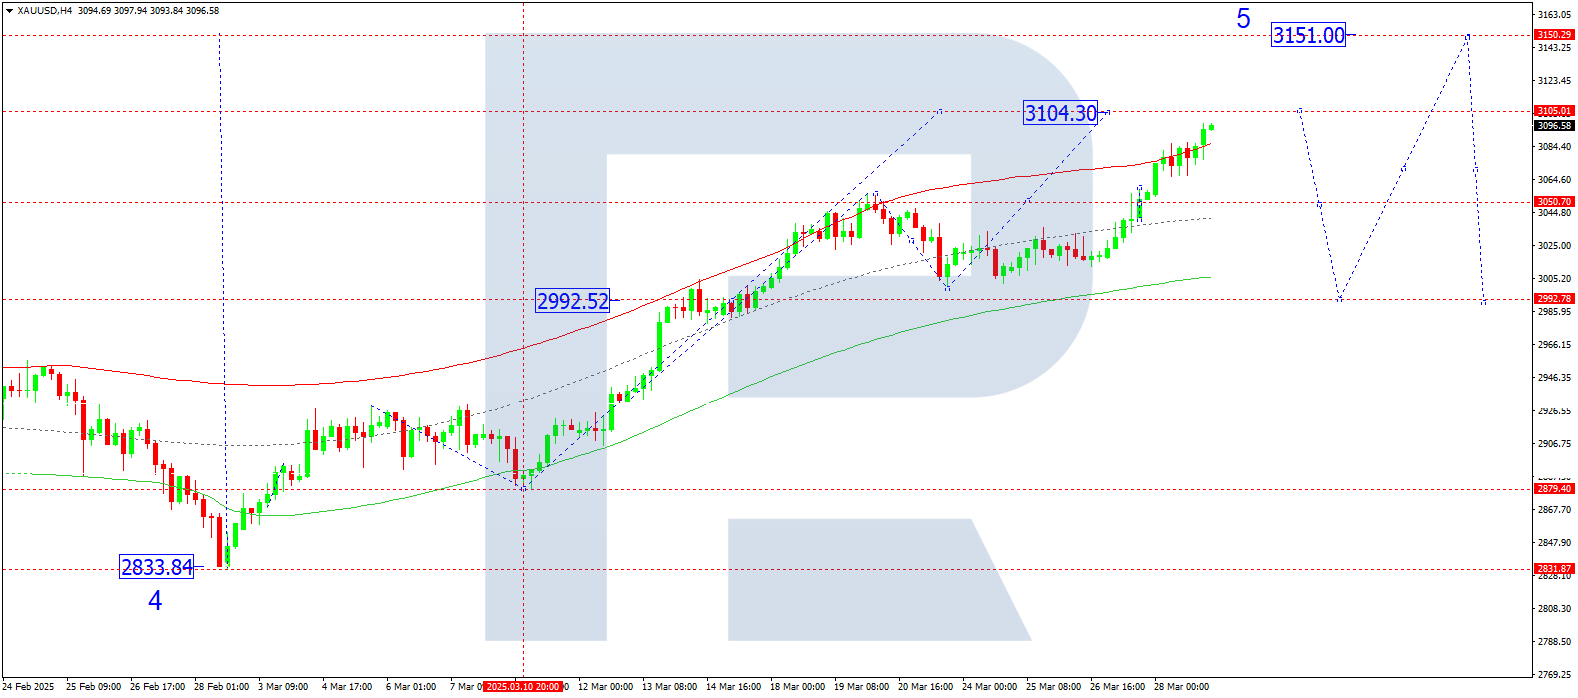
XAUUSD forecast
On the H4 chart of XAUUSD, the market continues an upward wave towards 3,104. Today, 31 March 2025, this target is expected to be reached. Afterwards, a correction to 2,990 is possible. Once the correction is complete, a further upward wave towards 3,151 may develop.
Technically, this scenario is confirmed by the Elliott wave structure and the growth wave matrix with a pivot at 2,990, which is considered key for XAUUSD. The market continues to move towards the upper boundary of the Price Envelope at 3,104. A decline to the lower boundary at 2,990 may follow.
Technical indicators for today’s XAUUSD forecast suggest potential for growth to 3,104 and 3,151.
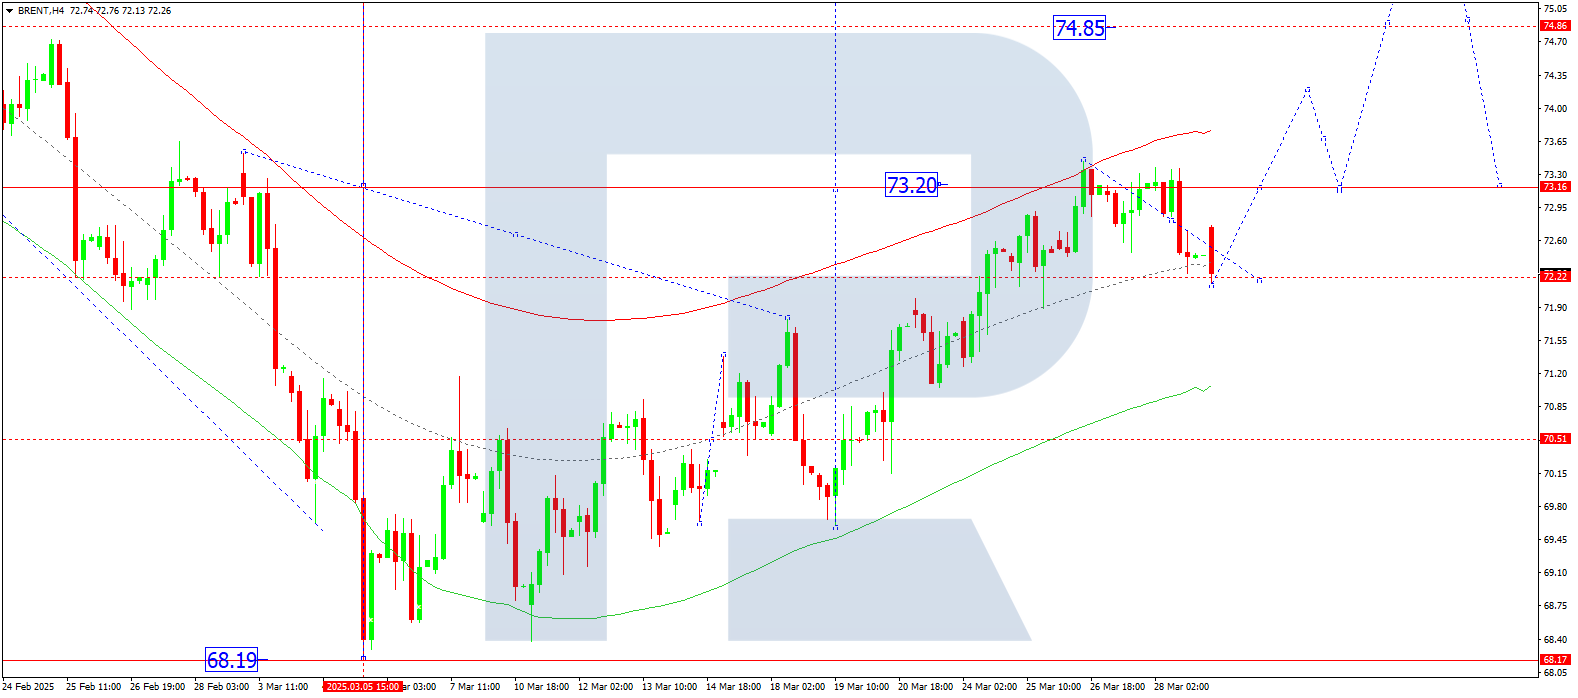
Brent forecast
On the H4 chart of Brent crude, the market completed a correction wave to 72.22. Today, 31 March 2025, a move up to 74.00 is expected. After that, a correction to 72.00 may begin. This may lead to a consolidation range between these levels. A breakout downward may result in a move to 70.50, while a breakout upward may lead to 74.88.
Technically, this scenario is confirmed by the Elliott wave structure and the growth wave matrix with a pivot at 72.00. It is considered key for Brent. Currently, the market completed a correction wave to the central line of the Price Envelope — 72.22. A move up to the upper boundary at 74.00 is likely.
Technical indicators in today’s Brent forecast suggest growth towards 74.00.