The news environment worsens the situation, with the pound falling against the US dollar. Find out more in our analysis for 18 November 2024.
GBPUSD forecast: key trading points
- The Rightmove UK House Price Index (y/y): previously at 1.0%, currently at 1.2%
- NIESR UK monthly GDP tracker: previously at 0.2%
- GBPUSD forecast for 18 November 2024: 1.2500
Fundamental analysis
The Rightmove UK House Price Index shows the change in the average price of residential properties for sale. A reading above the forecast and the previous value is a positive factor for the British pound, while a weaker-than-expected figure points to adverse developments. The previous statistics were below forecasts; however, the figure is currently 1.2%, which may support the British currency.
The UK monthly GDP tracker from the National Institute of Economic and Social Research (NIESR, NI) is a tool that provides real-time estimates of the country’s economic growth. It analyses key economic data, including services and construction, to determine the current GDP dynamics before official statistics are released. This enables faster responses to economic changes and forecasts economic development.
The previous reading was 0.2% and may remain flat, according to the forecast for 18 November 2024. Although there are few positive factors for the British pound, there is potential for a correction before further declines.
GBPUSD technical analysis
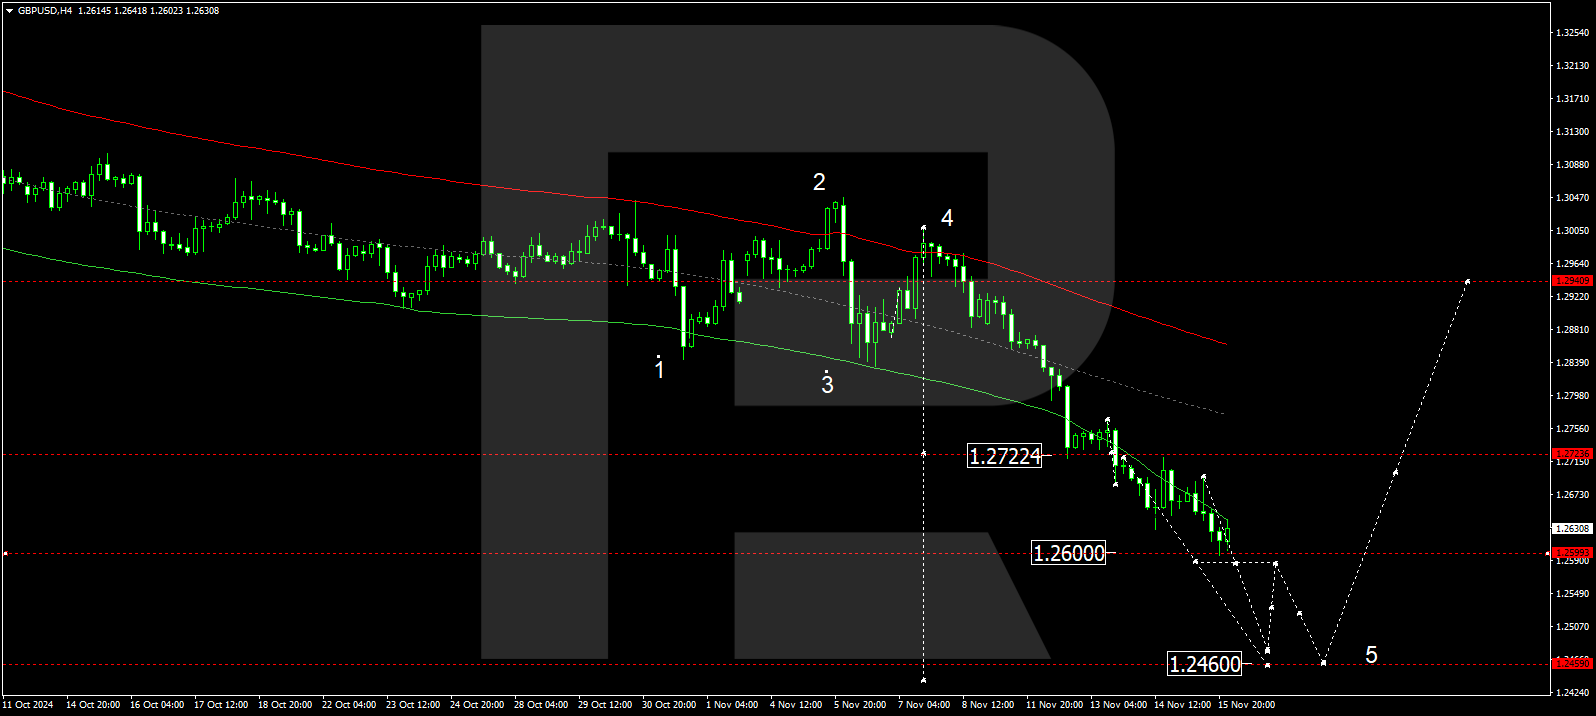
The GBPUSD H4 chart shows that the market has reached 1.2600. A consolidation range could form above this level today, 18 November 2024. The price could correct to 1.2650 in the event of an upward breakout. Conversely, a breakout below the range could push the price to 1.2500, potentially continuing towards 1.2460.
The Elliott Wave structure and matrix of the downward wave’s second half, with a pivot point at 1.2722, technically support this scenario for the GBPUSD rate. The market continues to decline towards the lower boundary of the price envelope at 1.2460. After reaching this level, the price could rise to the envelope’s centre at 1.2722. A breakout above this level would open the potential for a further correction towards the envelope’s upper boundary at 1.2940.


Summary
Coupled with technical analysis for today’s GBPUSD forecast, weak UK fundamental data suggests that the downward wave could continue towards the 1.2500 level.