The JP 225 stock index is trading within a limited range, with a triangle technical pattern forming on the chart. The JP 225 forecast for next week is neutral.
JP 225 forecast: key trading points
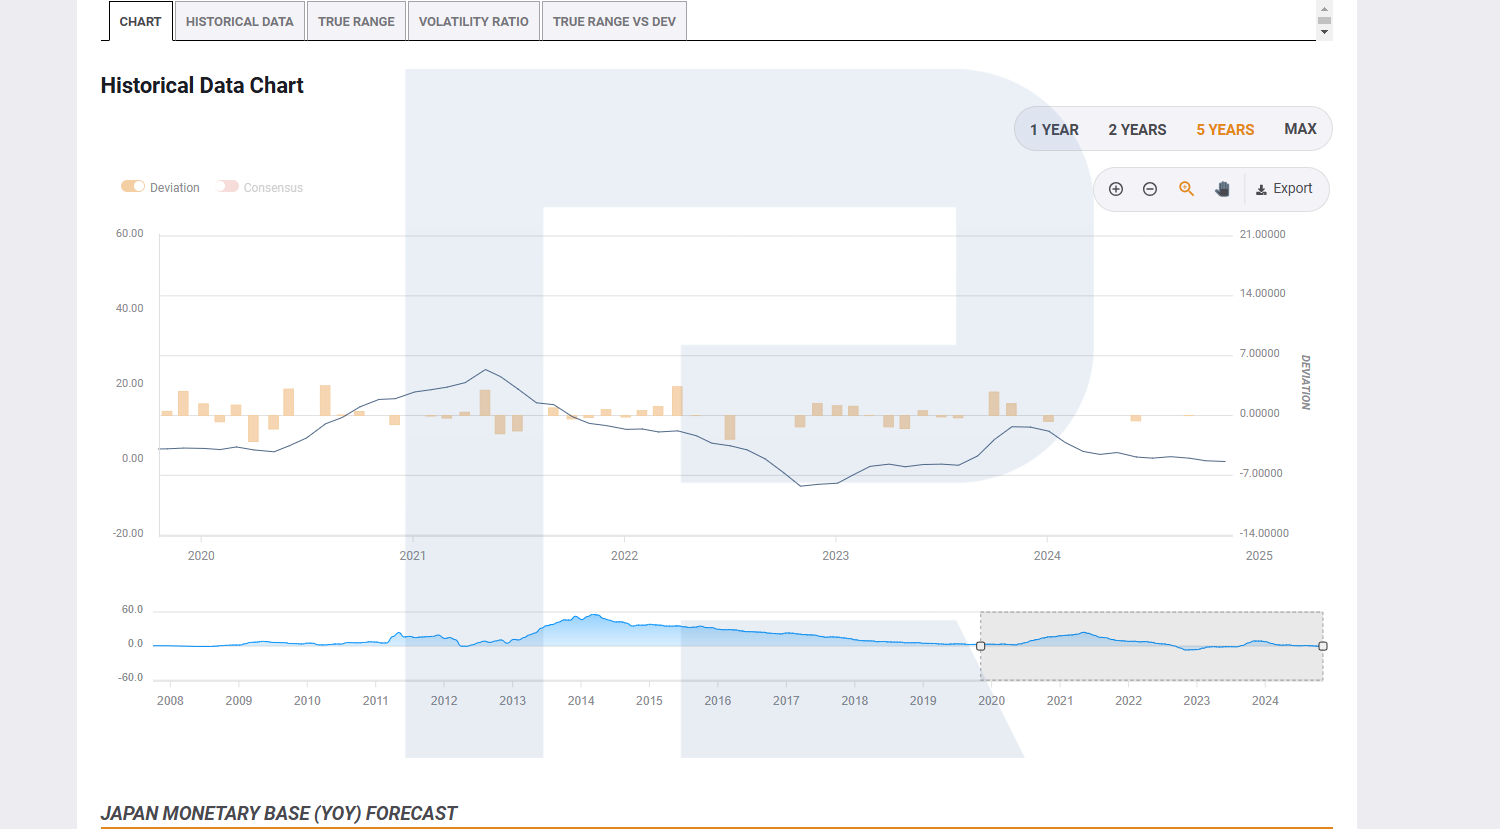
- Recent data: the monetary base indicator has decreased by 0.3%
- Economic indicators: the monetary base reflects changes in the money supply in circulation and assesses the impact of inflation
- Market impact: the 0.3% decline indicates a potential slowdown in inflation
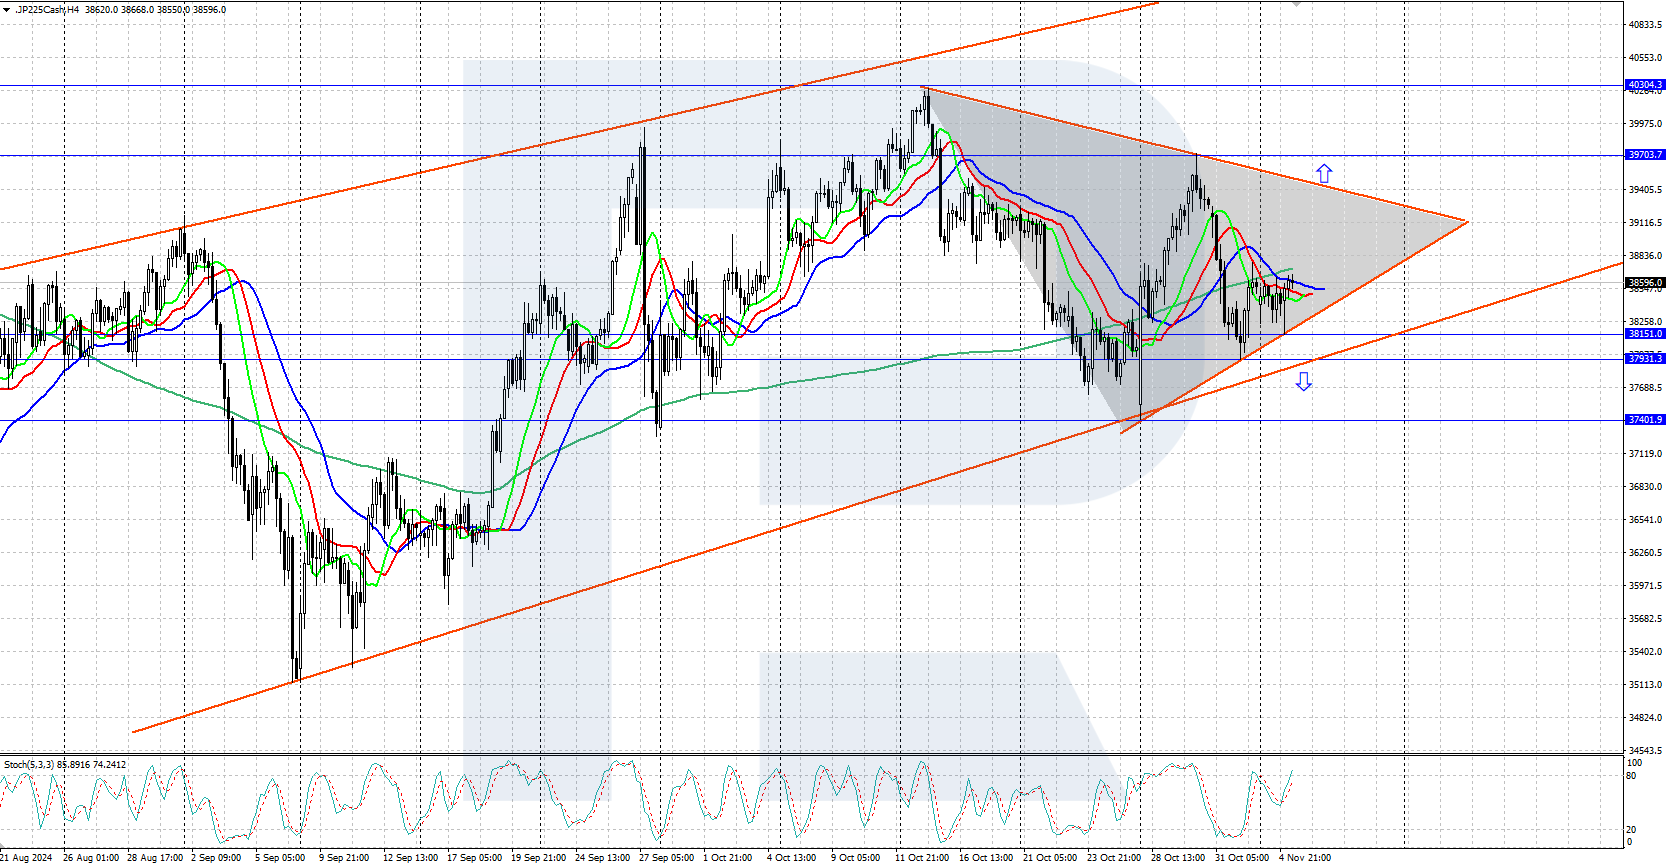
- Resistance: 38,150.0, Support: 39,700.0
- JP 225 price forecast: 39,500.0
Fundamental analysis
The monetary base indicator declined by 0.3% in October, following a 0.1% reduction in the money supply in September. The downtrend in financial resources may indicate diminishing inflationary pressures in the country and contribute to the yen’s depreciation.


Source: FX Street
Japan’s annual inflation rate fell from 3.0% to 2.5% in September 2024, in line with the fiscal 2024 forecast.
Bank of Japan Governor Kazuo Ueda’s recent comments do not signal any serious commitment to lowering the interest rate. He stated that more time is needed to achieve the 2.0% inflation target sustainably.
Uncertainty regarding the upcoming US presidential election also prevents market participants from making global decisions. They prefer to gain better insight into future trade relations with the US and are already considering the potential influence of the new head of the White House.
JP 225 technical analysis
The JP 225 stock index is trading within a limited range, with a triangle pattern forming on the chart. A breakout from the pattern boundaries may determine the direction of near-term index movements.


The following scenarios are considered for the JP 225 price forecast:
- Pessimistic JP 225 forecast: if the price drops below the 38,150.0 support level, the index could fall to 37,400.0
- Optimistic JP 225 forecast: a breakout above the 39,700.0 resistance level could drive the price to 40,300.0 and above
Summary
The JP 225 stock index is trading within a limited range at the beginning of the week, with a triangle technical pattern forming on the chart. Market participants are awaiting the outcome of the US presidential election to make further trading decisions.