In this US 30 analysis, we observe that the US 30 index is currently undergoing a correction after reaching a new high in the previous session. Discover more in our detailed US 30 forecast and outlook for the next week.
US 30 forecast: key trading points
- The US 30 Index reached a new record high in July this year
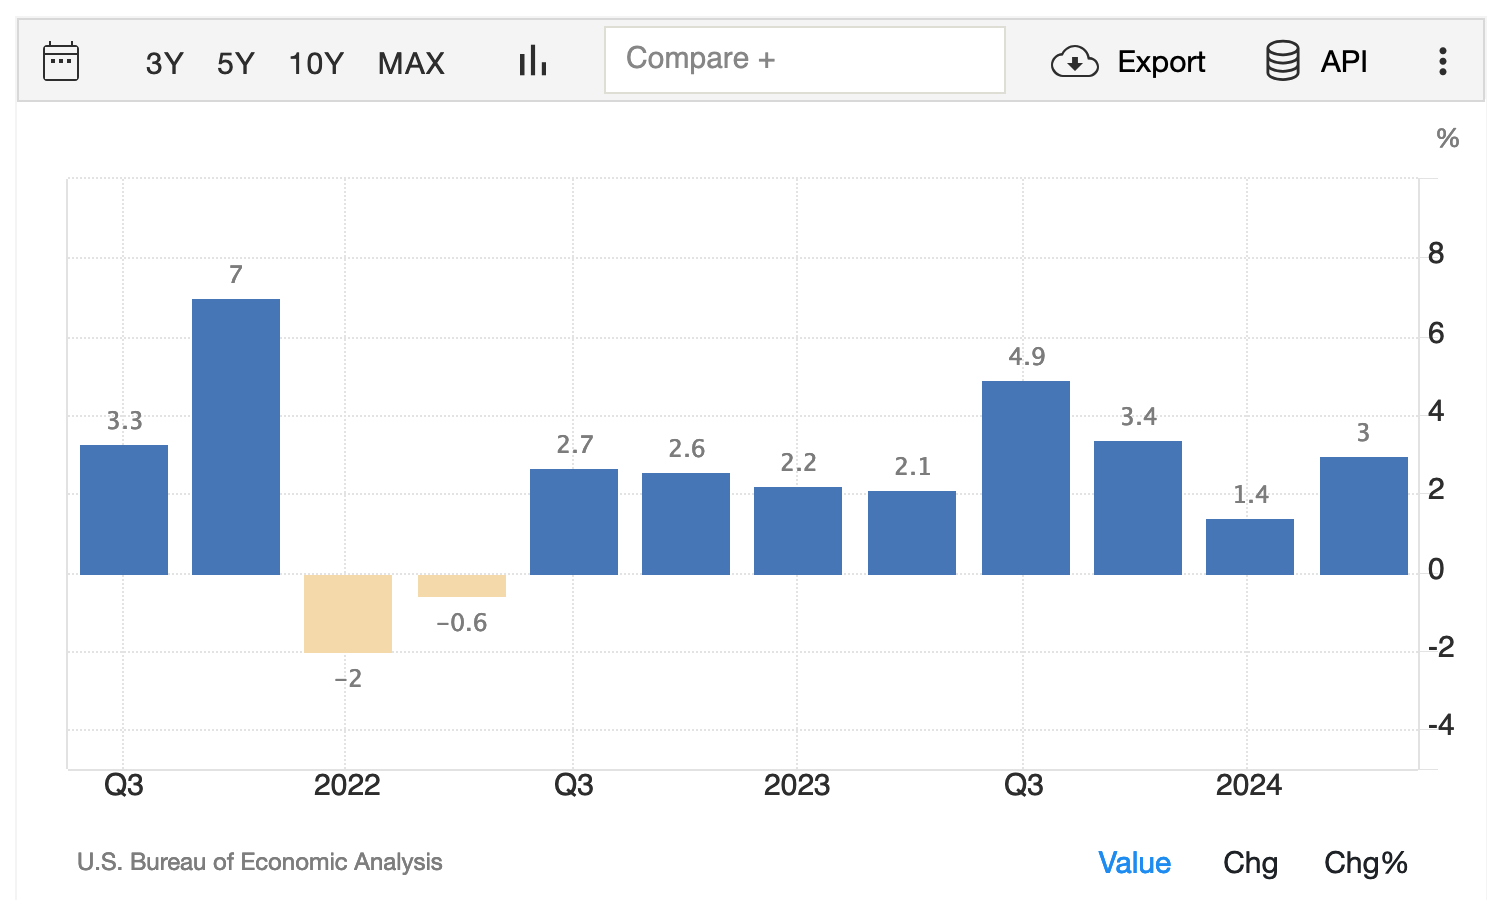
- US Q2 GDP growth was revised upward to 3.0%
- US personal spending increased by 2.9%, surpassing the earlier estimate of 2.3%
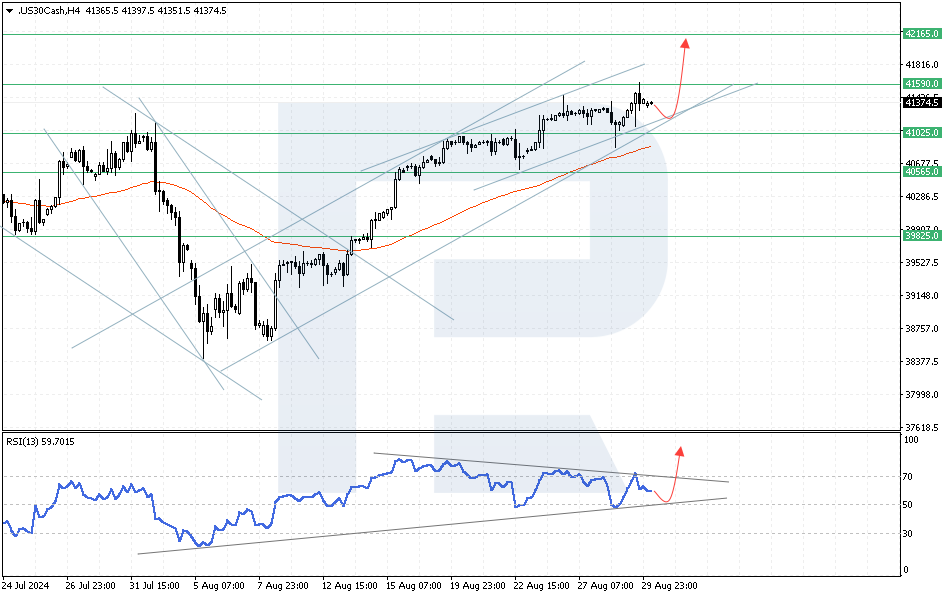
- Resistance: 41,590.0, Support: 41,025.0
- US 30 price forecast: 41,590.0 and 42,165.0
Fundamental analysis
According to recent US 30 news, the index set a new record for July, driven by robust US economic data that highlights the economy’s resilience despite the Federal Reserve’s elevated interest rates.


Source: https://tradingeconomics.com/united-states/gdp-growth
This positive outlook was supported by revised data, which showed that US Q2 GDP growth was adjusted upward to 3.0% from 2.8%, while personal spending – a key driver of economic growth – rose 2.9%, exceeding the previous estimate of 2.3%. Additionally, another report indicated that initial jobless claims fell by 2,000 to 231,000 from the prior week.
US 10-year government bond yields remain steady at 3.86% ahead of the upcoming release of the PCE price index, a critical indicator for the Federal Reserve. Investors are monitoring this data closely, as a decline in inflation, as reflected by this index, may prompt the Fed to consider lowering interest rates, which could significantly impact the US 30 prediction.
US 30 technical analysis
The US 30 index is correcting after a rebound from the resistance level at 41,590.0. A signal for a potential decline was observed when the RSI tested the resistance line. However, the potential for continuing the upward trend as RSI values approach the support line remains. The US 30 forecast suggests a test of the lower boundary of the bullish channel at 41,275.0, followed by a rise to 41,590.0. Should the resistance at 41,590.0 be breached, the index could advance towards 42,165.0. An additional signal supporting this scenario would be a breakout above the support line on the RSI indicator. Conversely, a negative signal for buyers would be the consolidation of the index below 41,025.0, indicating a potential breakdown of the ascending channel’s lower boundary, with a downside target of 40,565.0.


Key US 30 levels to watch include:
- Resistance level: 41,590.0 – if the price breaks above this level, it could target 42,165.0
- Support level: 41,025.0 – a breakout below this level will signal a trend reversal, with the target at 40,565.0
Summary
This US 30 analysis highlights that the index has recently reached a local high and appears poised for further gains, supported by positive US 30 news and robust economic data. The US 30 forecast for the next week anticipates a growth wave toward 41,590.0, with a potential move to 42,165.0 if this level is breached, reinforcing the positive outlook and prediction for the index.