The US 500 stock index is progressively updating its historical highs, but the growth momentum is weakening, and the probability of a corrective decline is increasing. The forecast for the US 500 for the next week is negative.
US 500 forecast: key trading points
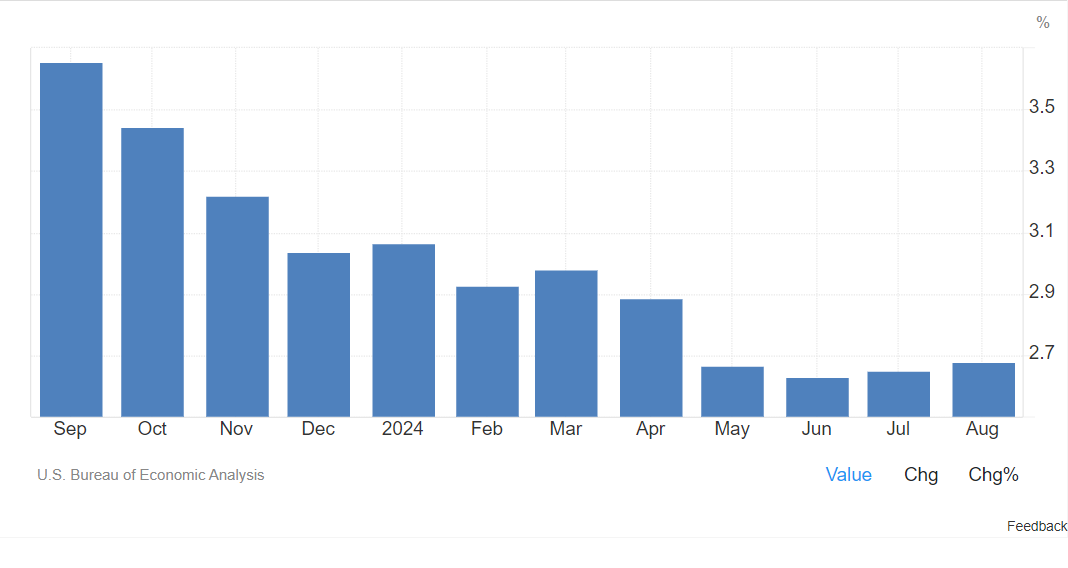
- Recent data: Core PCE inflation was 2.7% year-on-year.
- Economic indicators: this indicator does not include food and energy prices due to their volatility.
- Market impact: PCE is closely monitored by the US Fed as it gives a clearer picture of inflation trends
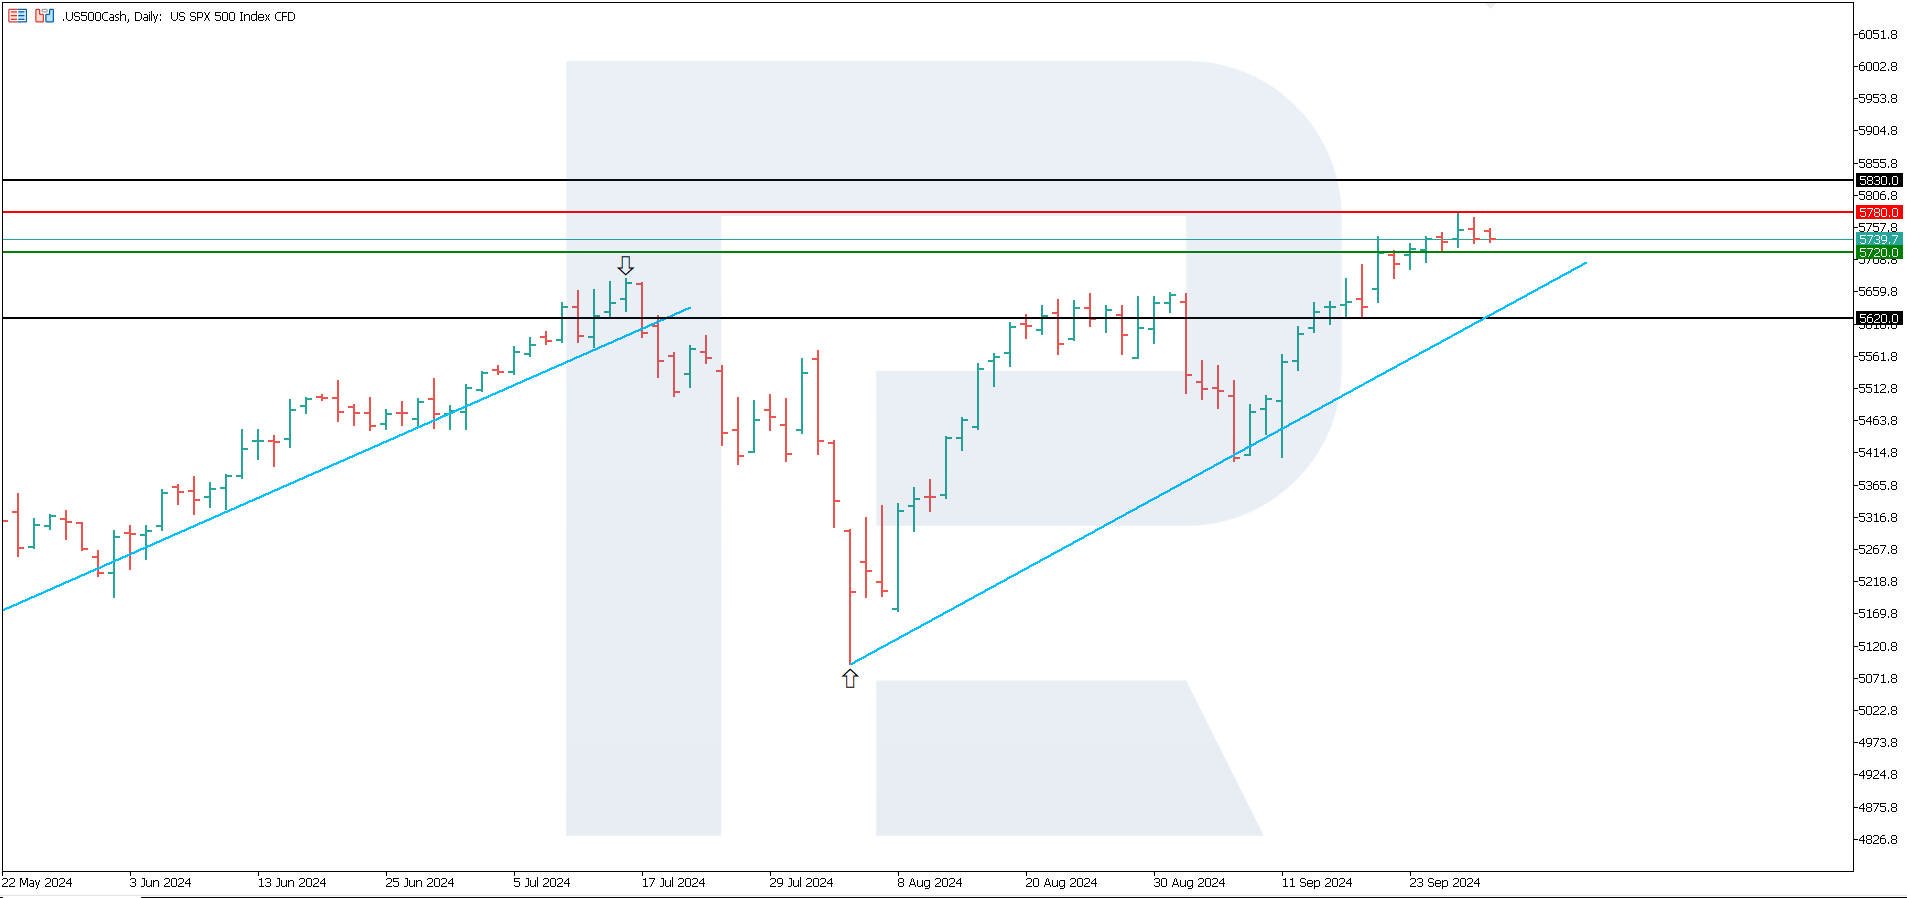
- Resistance: 5,780.0, Support: 5,720.0
- US 500 price forecast: 5,830.0
Fundamental analysis
Core PCE inflation, which excludes food and energy prices due to their volatility, remains stable at 2.7%, aligning with expectations. The US Federal Reserve closely monitors this indicator as it provides a clearer picture of inflation trends.


Source: https://tradingeconomics.com/united-states/core-pce-price-index-annual-change
The core PCE inflation rate demonstrates that the indicator is under control. This allows the Fed to maintain and, if necessary, adjust interest rates. Such data reflects a complex inflation picture, emphasising both the easing pressure and the need for close monitoring by the monetary authorities.
Current PCE core inflation statistics may indicate inflationary pressures that have not yet fully eased. If such dynamics persist, the Fed may prefer to maintain the current rate or even consider raising it further. However, for the final decision, the Fed considers several factors, including economic growth, unemployment, consumer activity and global risks, so its reaction will depend on the totality of all these data. Based on the above, the forecast for the US 500 index is negative.
US 500 technical analysis
The US 500 stock index is in an uptrend, although it is showing signs of slowing down. We should expect a corrective decline and new growth to the historical maximum. The breakout of the current support level – 5,720.0 – will signal the start of the correction. From the point of view of technical analysis of the US 500, the downside target could be 5,620.0.


Within the US 500 price outlook, the following scenarios are identified:
- Pessimistic forecast for the US 500: if the 5,720.0 support level is breached, the quotes may fall to 5,620.0.
- Optimistic forecast for the US 500: if the resistance level at 5,780.0 is breached, the index may rise to 5,830.0.
Summary
Core PCE inflation (which excludes food and energy prices due to their volatility) remains stable at 2.7%. In such a situation, the US Fed is free to act. The current inflation indicators even allow the Fed to raise the discount rate, but the main market participants still expect a reduction. Against this background, the US 500 index should anticipate a corrective decline with subsequent growth to new historical highs.