Weekly technical analysis and forecast (27–31 October 2025)
This weekly technical analysis highlights the key chart patterns and levels for EURUSD, USDJPY, GBPUSD, AUDUSD, USDCAD, gold (XAUUSD), and Brent crude oil to forecast market moves for the upcoming week (27–31 October 2025)
Major technical levels to watch this week
- EURUSD: Support: 1.1480, 1.124Resistance: 1.1730, 1.1780
- USDJPY: Support: 149.80, 146.6Resistance: 153.25, 154.30
- GBPUSD: Support: 1.3250, 1.315Resistance: 1.3500, 1.36362323-10
- AUDUSD: Support: 0.6400, 0.634Resistance: 0.6530, 0.6590
- USDCAD: Support: 1.3980, 1.394Resistance: 1.4044, 1.4111
- Gold: Support: 3,970, 3,94Resistance: 4,180, 4,380
- Brent: Support: 64.60, 62.62. Resistance: 64.74, 67.40
EURUSD forecast
Markets still focus on the prolonged budget fight in the US Congress and shutdown threats, which have become a chronic source of uncertainty for global markets. Despite the risk of a temporary halt in government services, investors still treat the dollar as a safe-haven asset. The euro remains under pressure due to the policy differential between the ECB and the Federal Reserve. Fed speakers signal readiness to keep rates high for longer than previously expected, which supports the dollar. European business activity and inflation data remains weak, fuelling expectations that the ECB will refrain from further tightening. Weaker German exports and higher regional geopolitical risks add to pressure on the euro. As a result, the fundamental backdrop still tilts the balance in favour of the US dollar.
EURUSD technical analysis
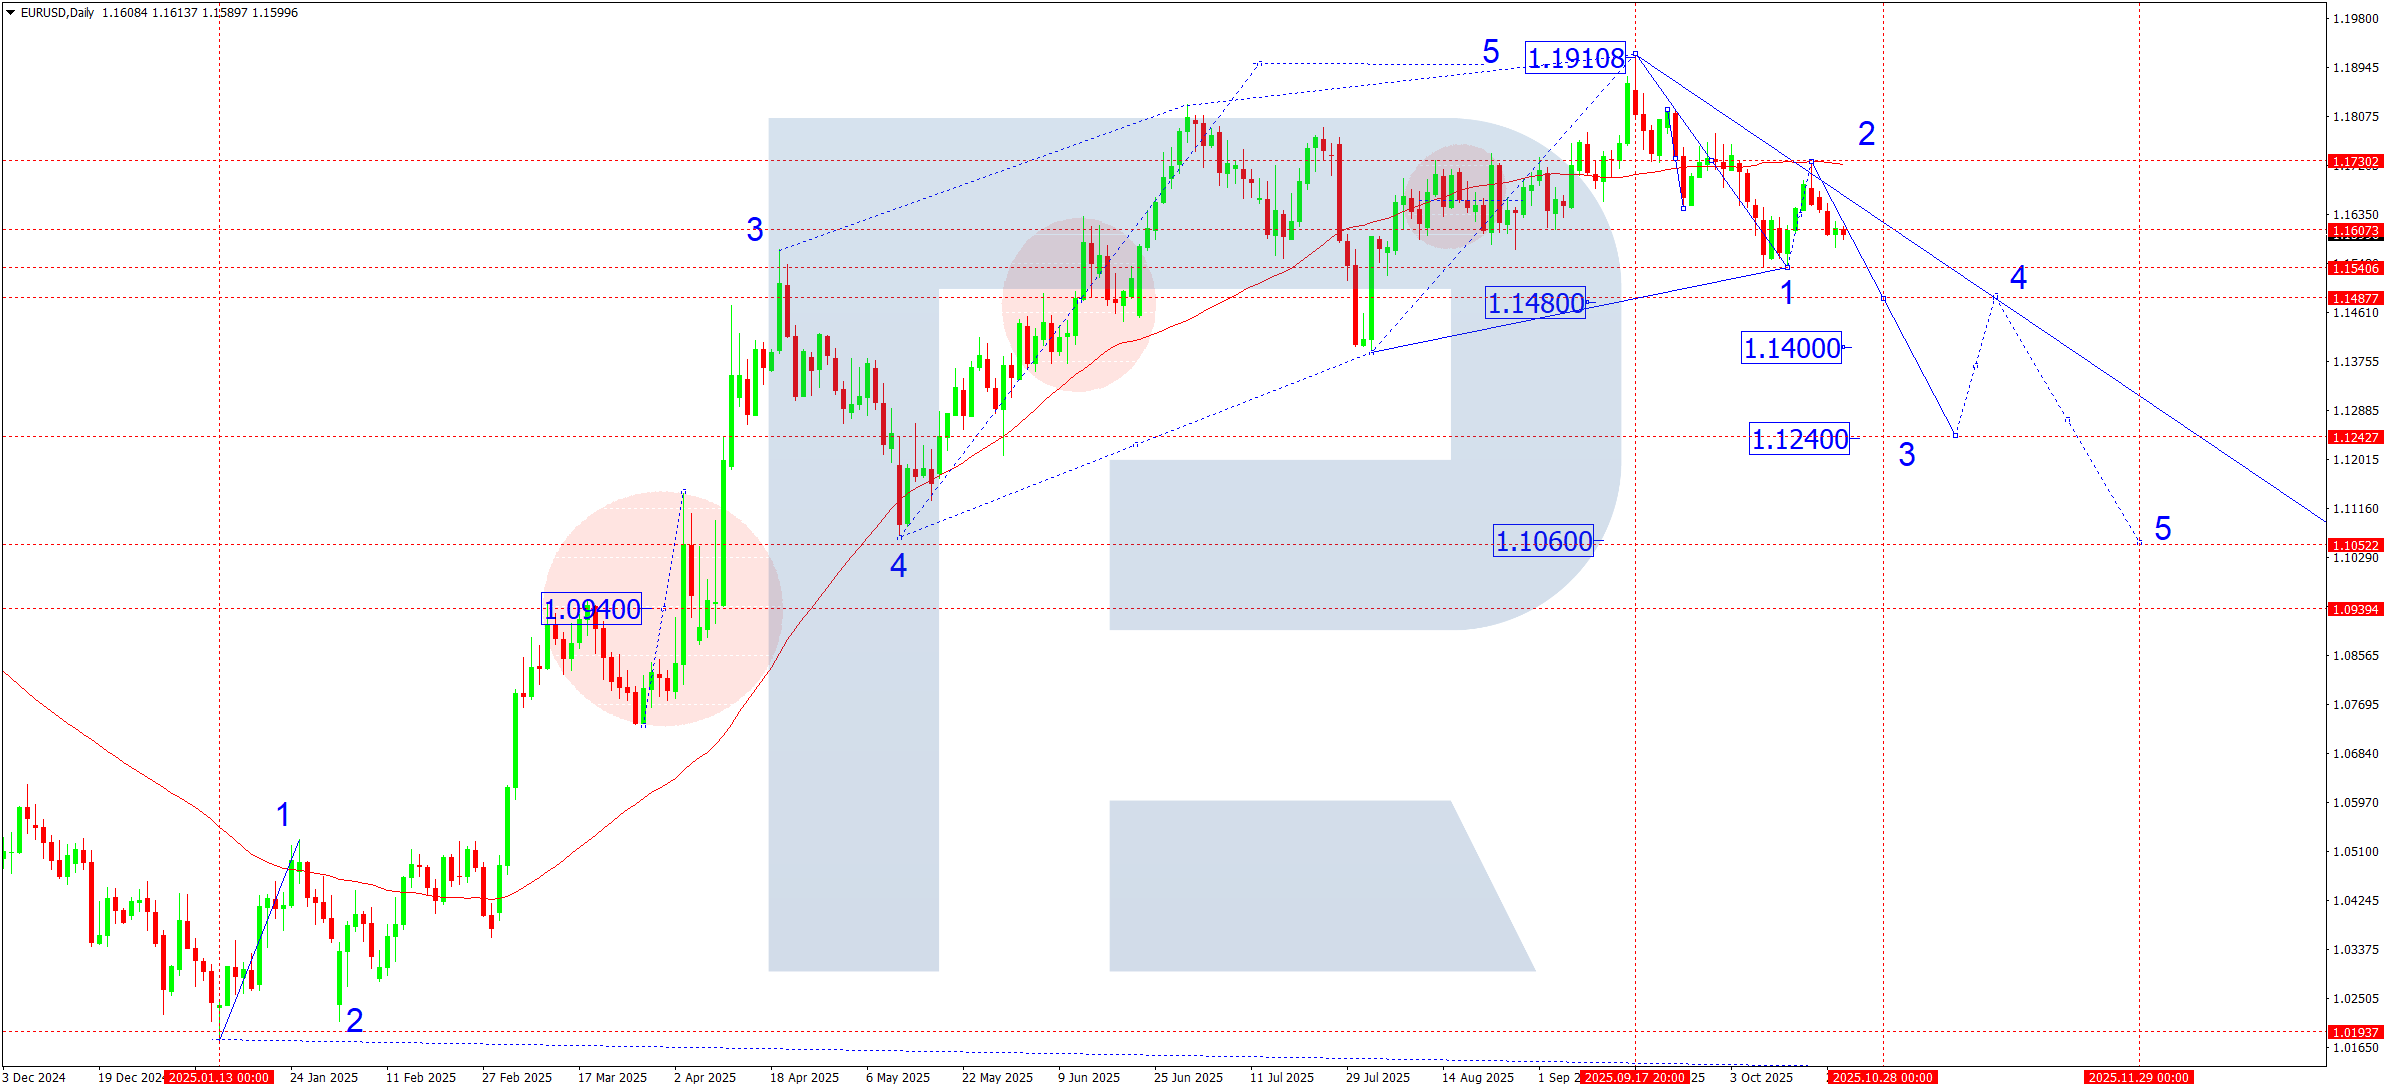
On the daily chart, the EURUSD pair rebounded from the SMA50 and keeps building a downward wave towards 1.1480. This week, the pair is expected to develop the first half of the third downward wave. After the price reaches this level, a consolidation range (pivot point) can form; the breakout will set the next impulse direction with scope to extend the wave towards 1.1240 as a local estimated target.
EURUSD forecast scenarios
Bearish (baseline) scenario: the market develops the third downward wave with key targets at 1.1480 and 1.1240
Bullish (alternative) scenario: if the price breaks above the 1.1730 level, a corrective structure can extend to 1.1820 and 1.1920
USDJPY forecast
The yen remains under pressure due to the persistent interest rate differential between the US and Japan. Federal Reserve rhetoric is moderately hawkish, with inflation and a resilient labour market supporting expectations that interest rates will remain high for longer than previously projected. At the same time, the Bank of Japan keeps a soft stance and points to the need for stable wage gains before any policy shift. This backdrop still favours further dollar strength against the yen.
USDJPY technical analysis
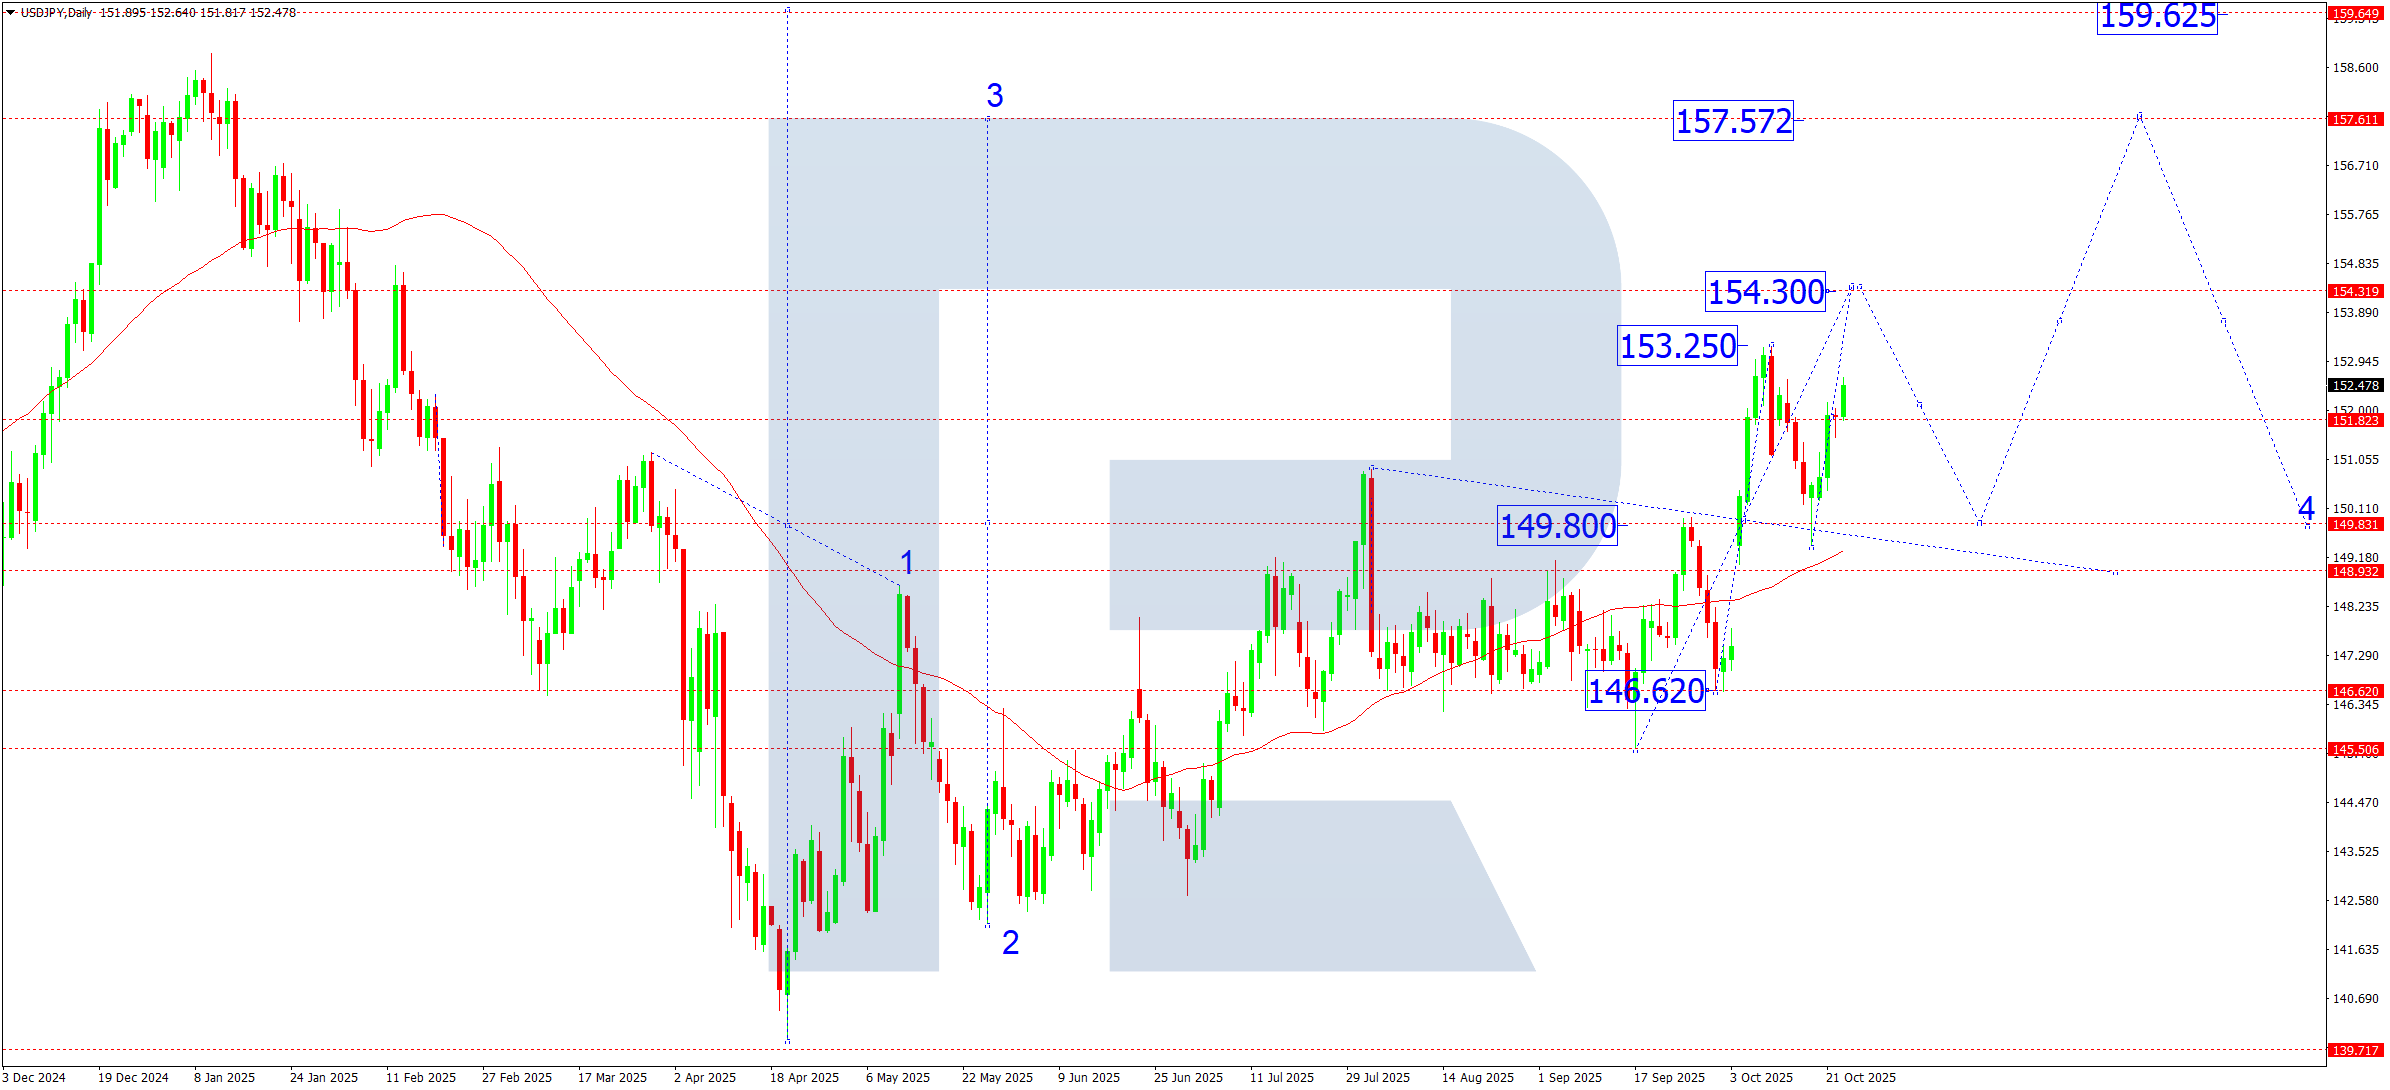
On the daily chart, the USDJPY pair decisively broke the key 151.82 level and consolidated above it. This price action confirms an upward wave structure that forms the third growth wave. In the week ahead, the pair is expected to continue its move towards 154.30, the local target of the current wave. After reaching it, a corrective leg back to 149.80 is possible. Later, the pair can resume the third growth wave with potential to reach 157.57, the estimated target of the wave structure.
USDJPY forecast scenarios
Bullish (baseline) scenario: a breakout above the 151.82 level opened the door to continued upward momentum.
- target 1: 154.30 (local within the structure)
- target 2: 157.57 (main target of the third growth wave)
Bearish (alternative) scenario: a firm breakout below 149.00 on rising volumes would signal a deeper correction towards 146.60 and lower.
GBPUSD forecast
The pound’s fundamental picture remains mixed. Pressure persists amid intensifying US shutdown and the dollar’s instability, yet global capital still prefers safe assets over risk currencies. The pound remains under pressure from weak UK macroeconomic data and softer business activity. Markets increasingly price a potential softening in the Bank of England’s tone as signs of cooling grow. A stronger US dollar, supported by expectations that the Fed will keep rates higher for longer, adds to the drag.
GBPUSD technical analysis
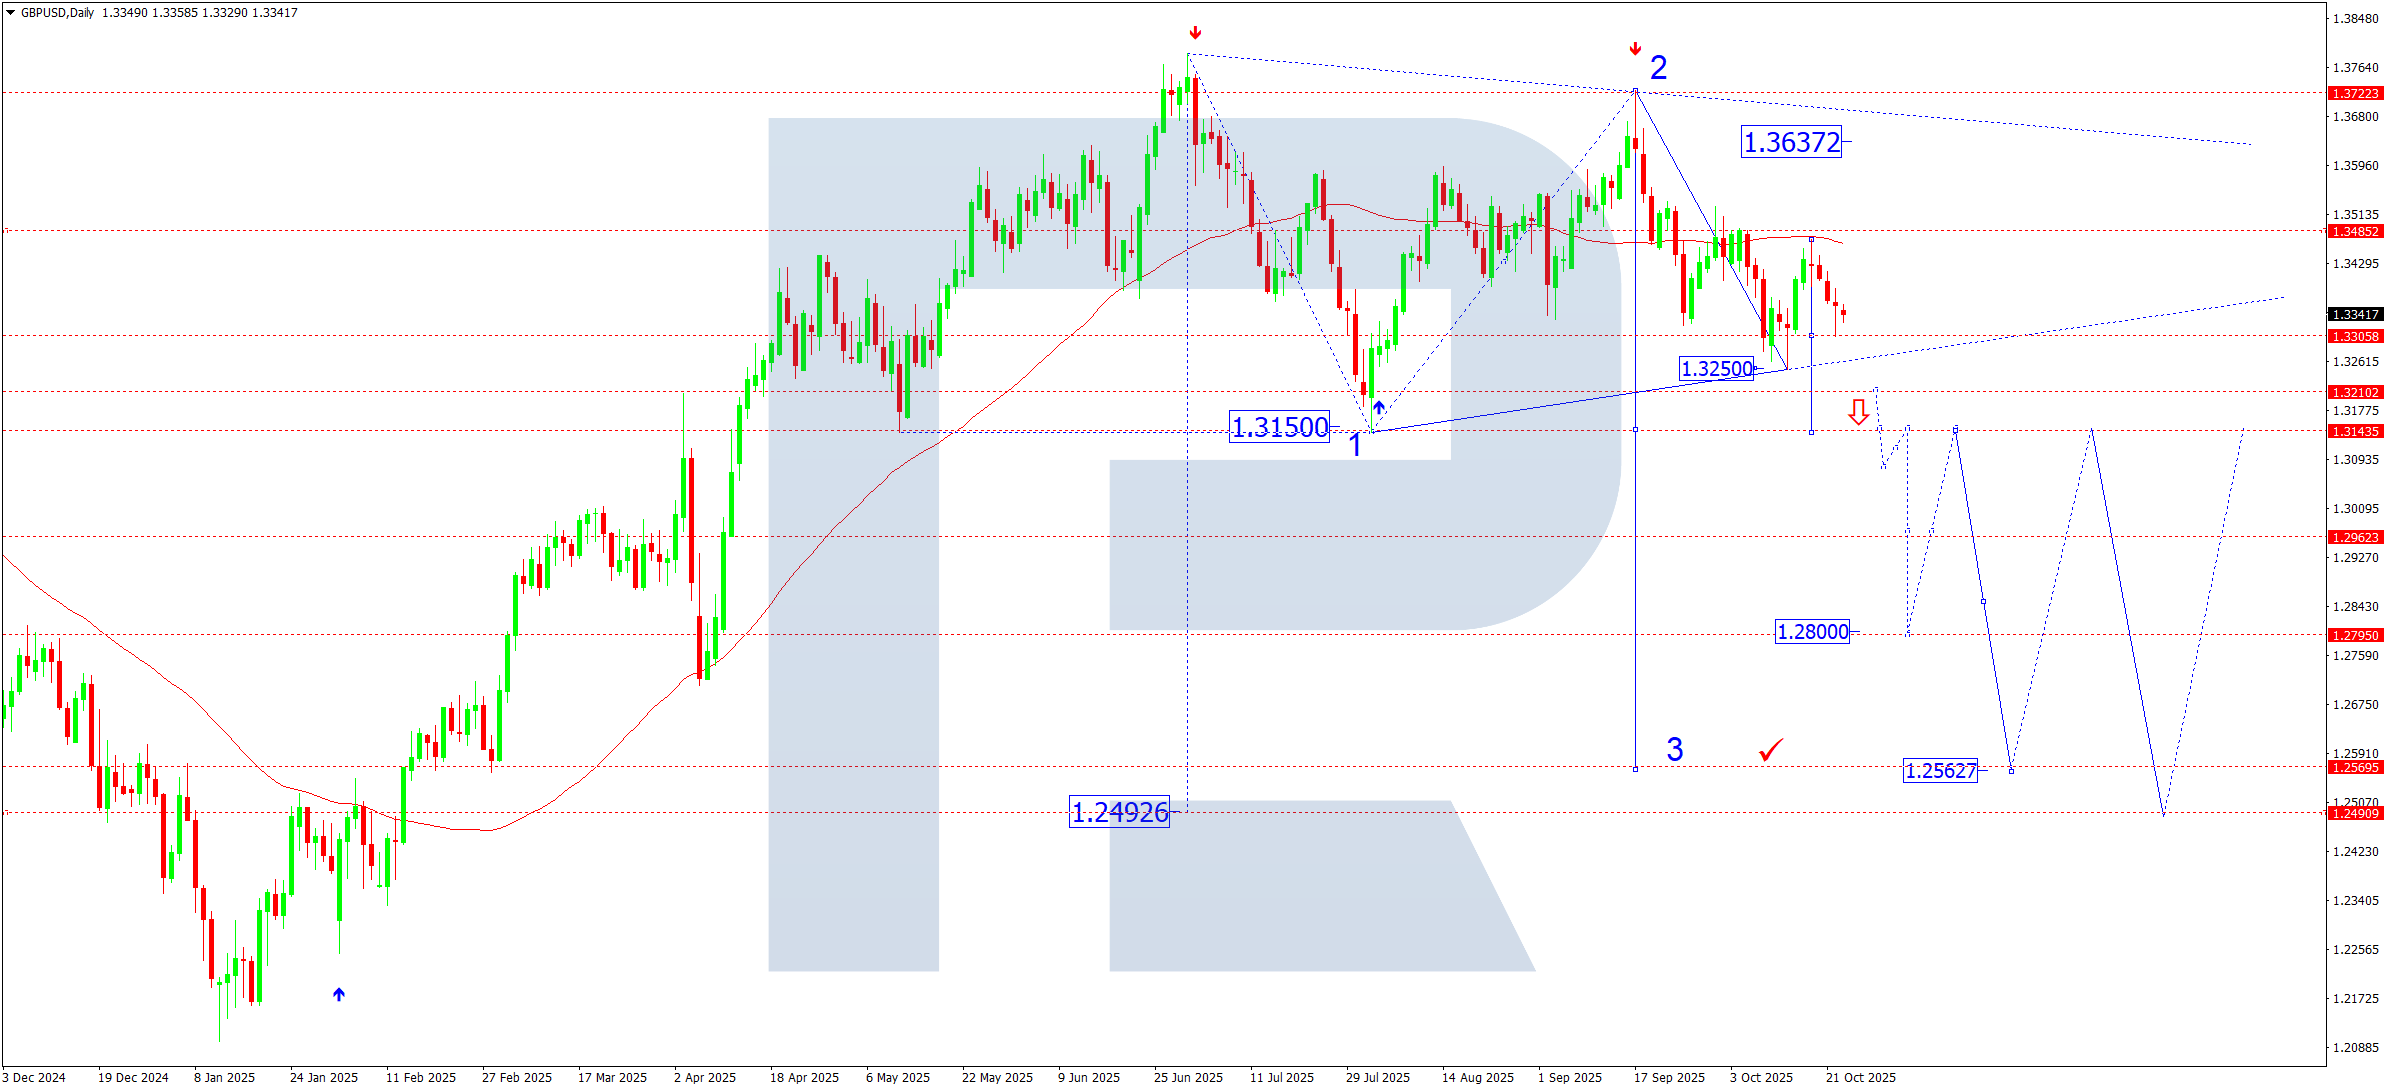
On the daily chart, the GBPUSD pair firmly rebounded from the SMA50 and continues to develop the third downward wave. The market completed a move to 1.3305. In the coming week, a compact consolidation range can form around this level. A downside breakout would extend the fall to 1.3150 – only the first half of the current wave. The 1.3150 level can act as a pivot pointp, from which the structure can project the next decline towards 1.2800, a local, estimated target for the medium-term impulse.
GBPUSD forecast scenarios
Bearish (main) scenario: the third-wave structure is developing, with targets at 1.3150–1.2800.
Bullish (alternative) scenario: a sustained hold above 1.3500 would open upside potential towards 1.3636 (upper boundary of the consolidation triangle).
AUDUSD forecast
The Australian dollar remains under pressure due to weaker demand for commodity assets and slower growth in China, Australia’s key trading partner. Softer Chinese industrial production data fuelled expectations of further monetary easing by the People’s Bank of China. Meanwhile, the RBA keeps a cautious tone and flags risks from slowing domestic consumption amid ongoing labour-market pressures. On the US side, inflation and labour data continue to support the dollar and limit AUD recovery potential. Markets will watch Australia’s inflation print and China’s PMI this week; results can set a short-term direction within the range, but the overall risk remains tilted towards a continuing downtrend.
AUDUSD technical analysis
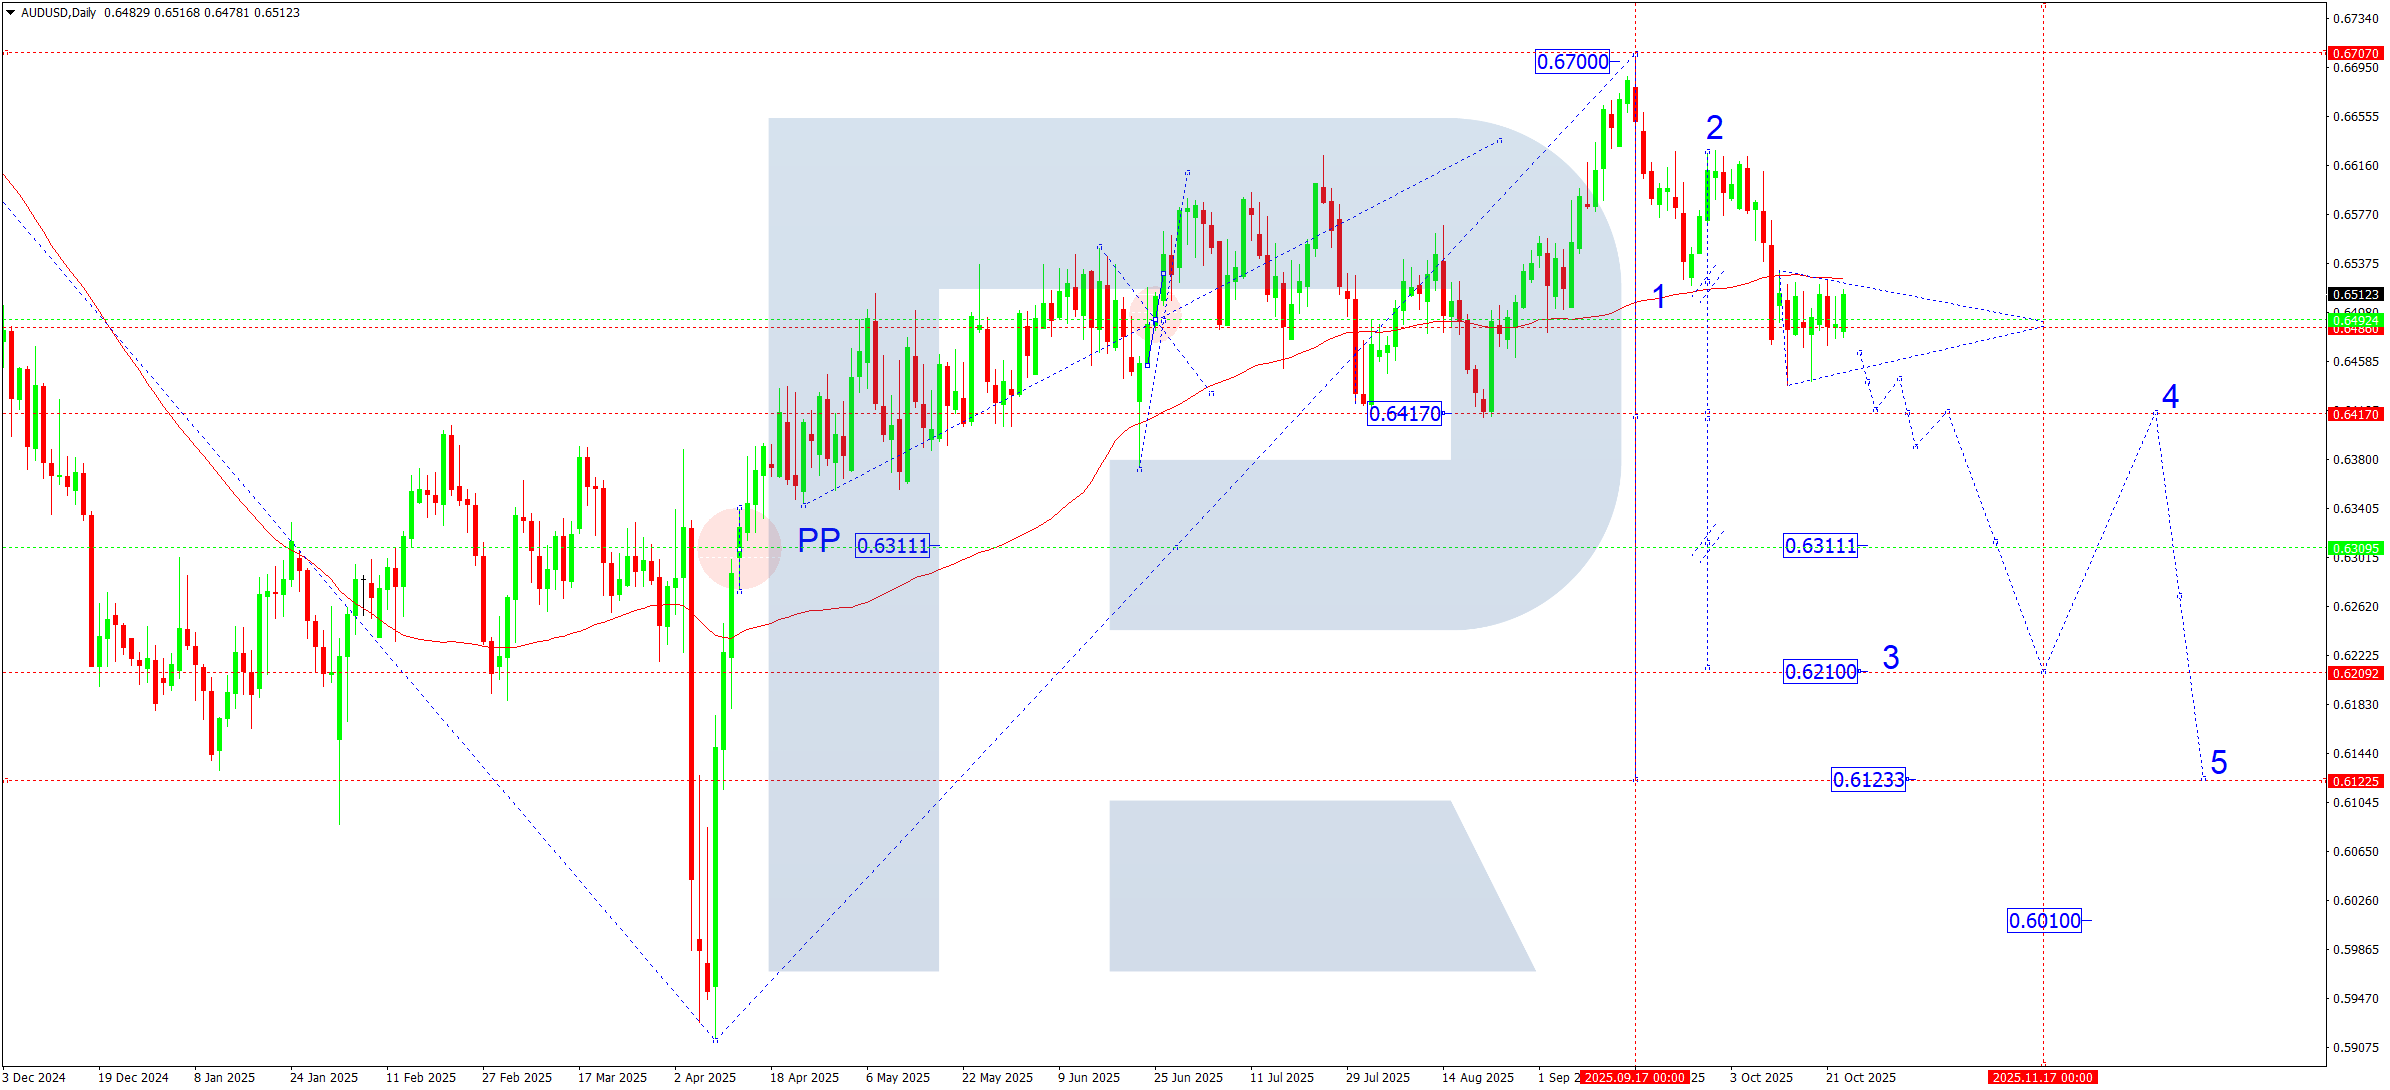
On the daily chart, the AUDUSD pair continues to form a wide consolidation range around 0.6485 below the SMA50, which keeps the bearish bias. In the coming week, the range can extend to 0.6420. A breakout below this level will open the way for a decline to 0.6311, with potential to extend the trend to 0.6210, an estimated local target. If the price leaves the range upwards, a corrective move to 0.6570 is possible. After it is complete, the downtrend will likely resume at least towards 0.6311.
AUDUSD forecast scenarios
Bearish (main) scenario: downside targets
- 0.6420 – intermediate target, confirmation of a new pivot point for the current wave
- 0.6210 – main target of the third downward wave
Bullish (alternative) scenario: a firm consolidation above 0.6530 could trigger a rise to 0.6623, where another correction top may form.
USDCAD forecast
The Canadian dollar remains sensitive to oil prices and Bank of Canada rate expectations. A modest recovery in crude limits pressure on the CAD, but overall demand for the US dollar stays high on strong US macroeconomic data and expectations that the Federal Reserve will maintain tight policy. Markets will focus on Canada’s GDP and US inflation indicators this week, which can deliver a short-term impulse.
USDCAD technical analysis
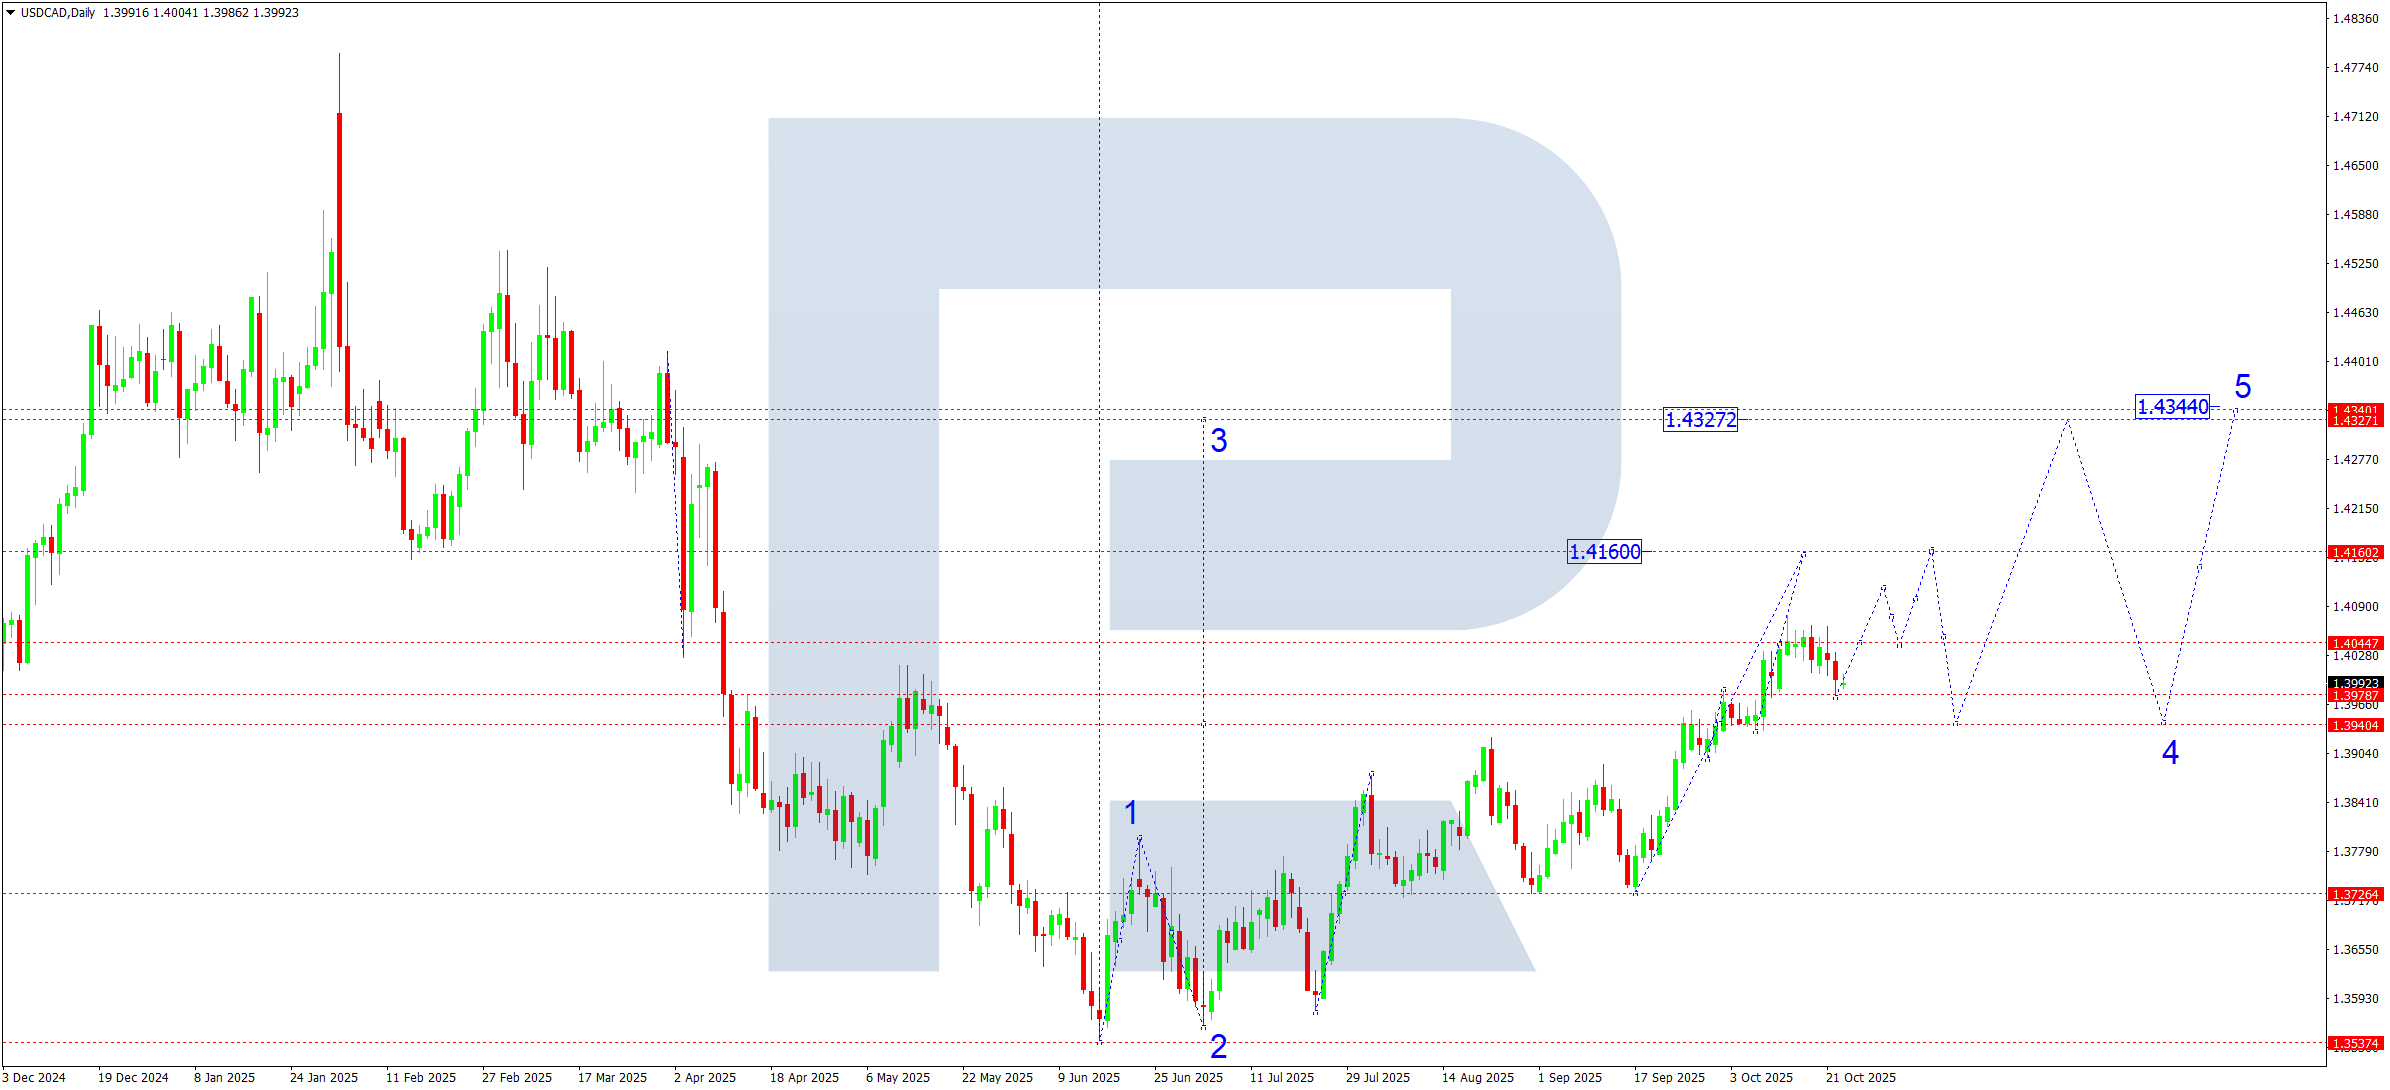
On the daily chart, the USDCAD pair completed a wide consolidation range around 1.3940 and broke higher, extending to 1.4075. This action set a pivot point for the entire upward wave. Last week, the price made a technical pullback to 1.3980, testing from above. In the short term, the pair is expected to maintain its upward trajectory towards 1.4160, the nearest estimated target. After reaching it, a corrective leg to 1.3940 is possible. Later, once the correction ends, the market can shift into a new growth stage – the fifth wave in the third – with a local target at 1.4327–1.4344.
USDCAD forecast scenarios
Bullish (main) scenario: a breakout above 1.4044 would open the way for continued growth towards 1.4160 and higher.
Bearish (alternative) scenario: a breakout below 1.3940 would trigger a deeper correction towards the 1.3727 area.
XAUUSD forecast
Global commodity markets entered a phase of deep structural shifts. After sanctions on Russian oil companies, a new commodity cycle has begun, with oil effectively shaping the future inflation path. Prices are already approaching key thresholds, and projections of increases up to 200 per barrel no longer look unrealistic.
This turn changes inflation expectations and undermines the stability of current US monetary policy. A strong dollar and high rates, which had capped gold, can lose effectiveness. That creates ideal conditions to relaunch a long-term bullish cycle in XAUUSD. The market looks outwardly stable, but internal pressure grows. Current constraints on gold’s rise may look artificial – an attempt to contain broader market reactions. If crude rallies further and inflation pressure rises, the US risks a fresh wave of capital rotation into safe assets. In that case, gold could accelerate towards all-time ranges of 5,000–7,000 per ounce.
XAUUSD technical analysis
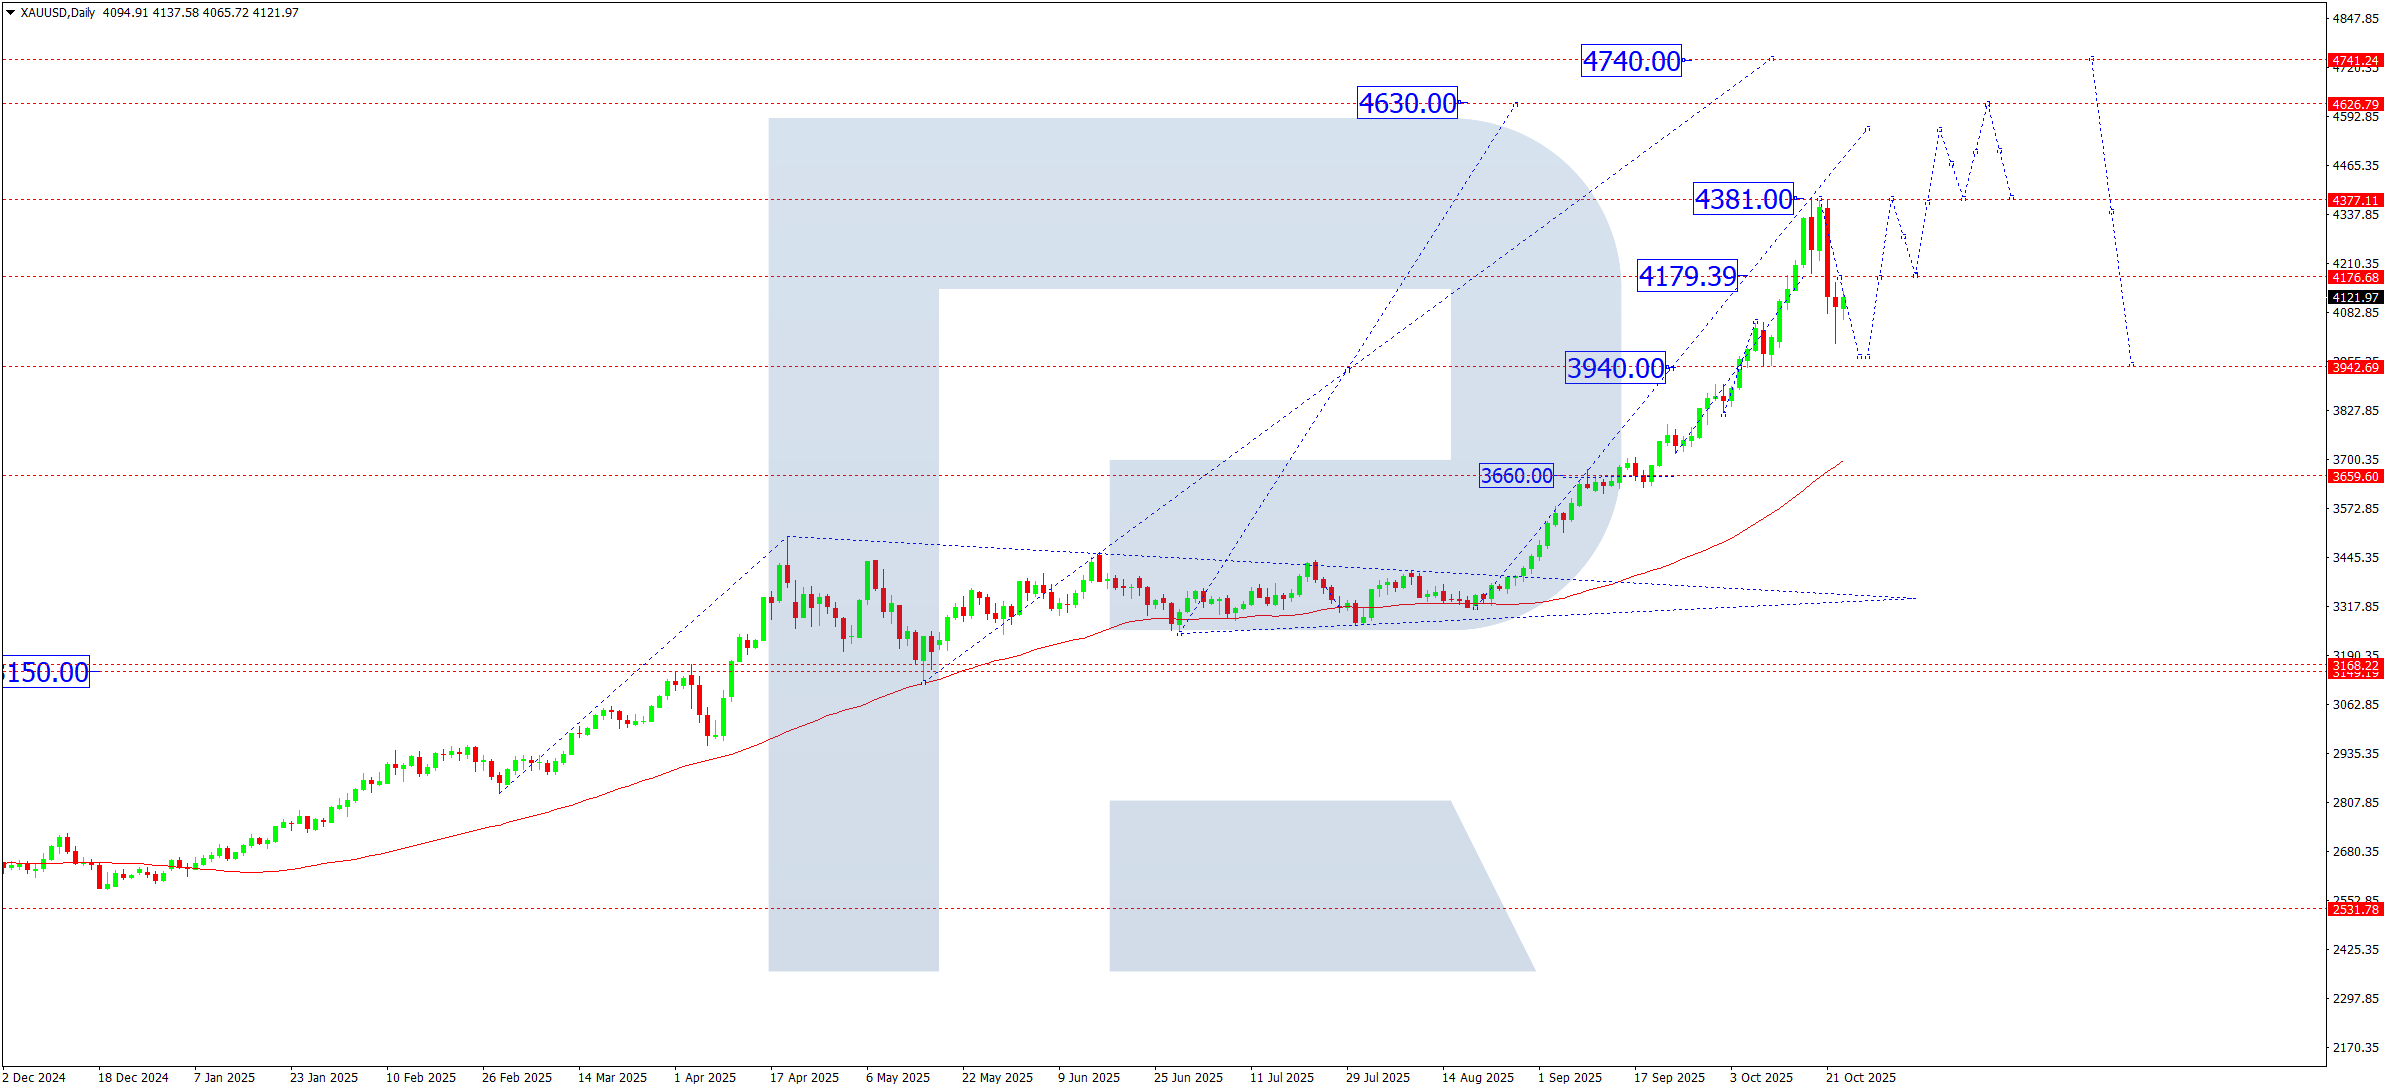
On the daily chart, XAUUSD prices broke below the 4,180 level and formed a corrective downward wave with a local target at 3,970. After it completes, a recovery attempt back to 4,180 is likely, where a consolidation range can form. The baseline scenario suggests a range-bound movement around 4,180, with the breakout direction defining the next leg. A consolidation above 4,180 would open potential for a continued medium-term uptrend towards 4,560, with potential to reach 4,630. A downside breakout can deepen the correction to 3,970 and then 3,660.
XAUUSD forecast scenarios
Bullish (main) scenario: confident consolidation above 4,180 with targets at 4,400, 4,560, and 4,630.
Bearish (alternative) scenario: continued pressure and consolidation below 4,180 may trigger a corrective wave to 3,970 and then 3,660.
Brent forecast
The oil market evolves at unprecedented speed. New sanctions against Russian oil companies effectively reset the global supply–demand balance and triggered a major structural shift. With rising geopolitical tensions in Europe, the Middle East, and around Venezuela, supply looks increasingly constrained while demand remains resilient. This combination forms a new price cycle, in which a range of 100–200 USD per barrel no longer looks unrealistic. Financial markets already respond with higher inflation expectations and stronger appetite for commodities. OPEC+ members, in turn, see the move as compensation for years of underpricing. The current phase increasingly resembles the start of a strategic fifth upward wave.
Brent technical analysis
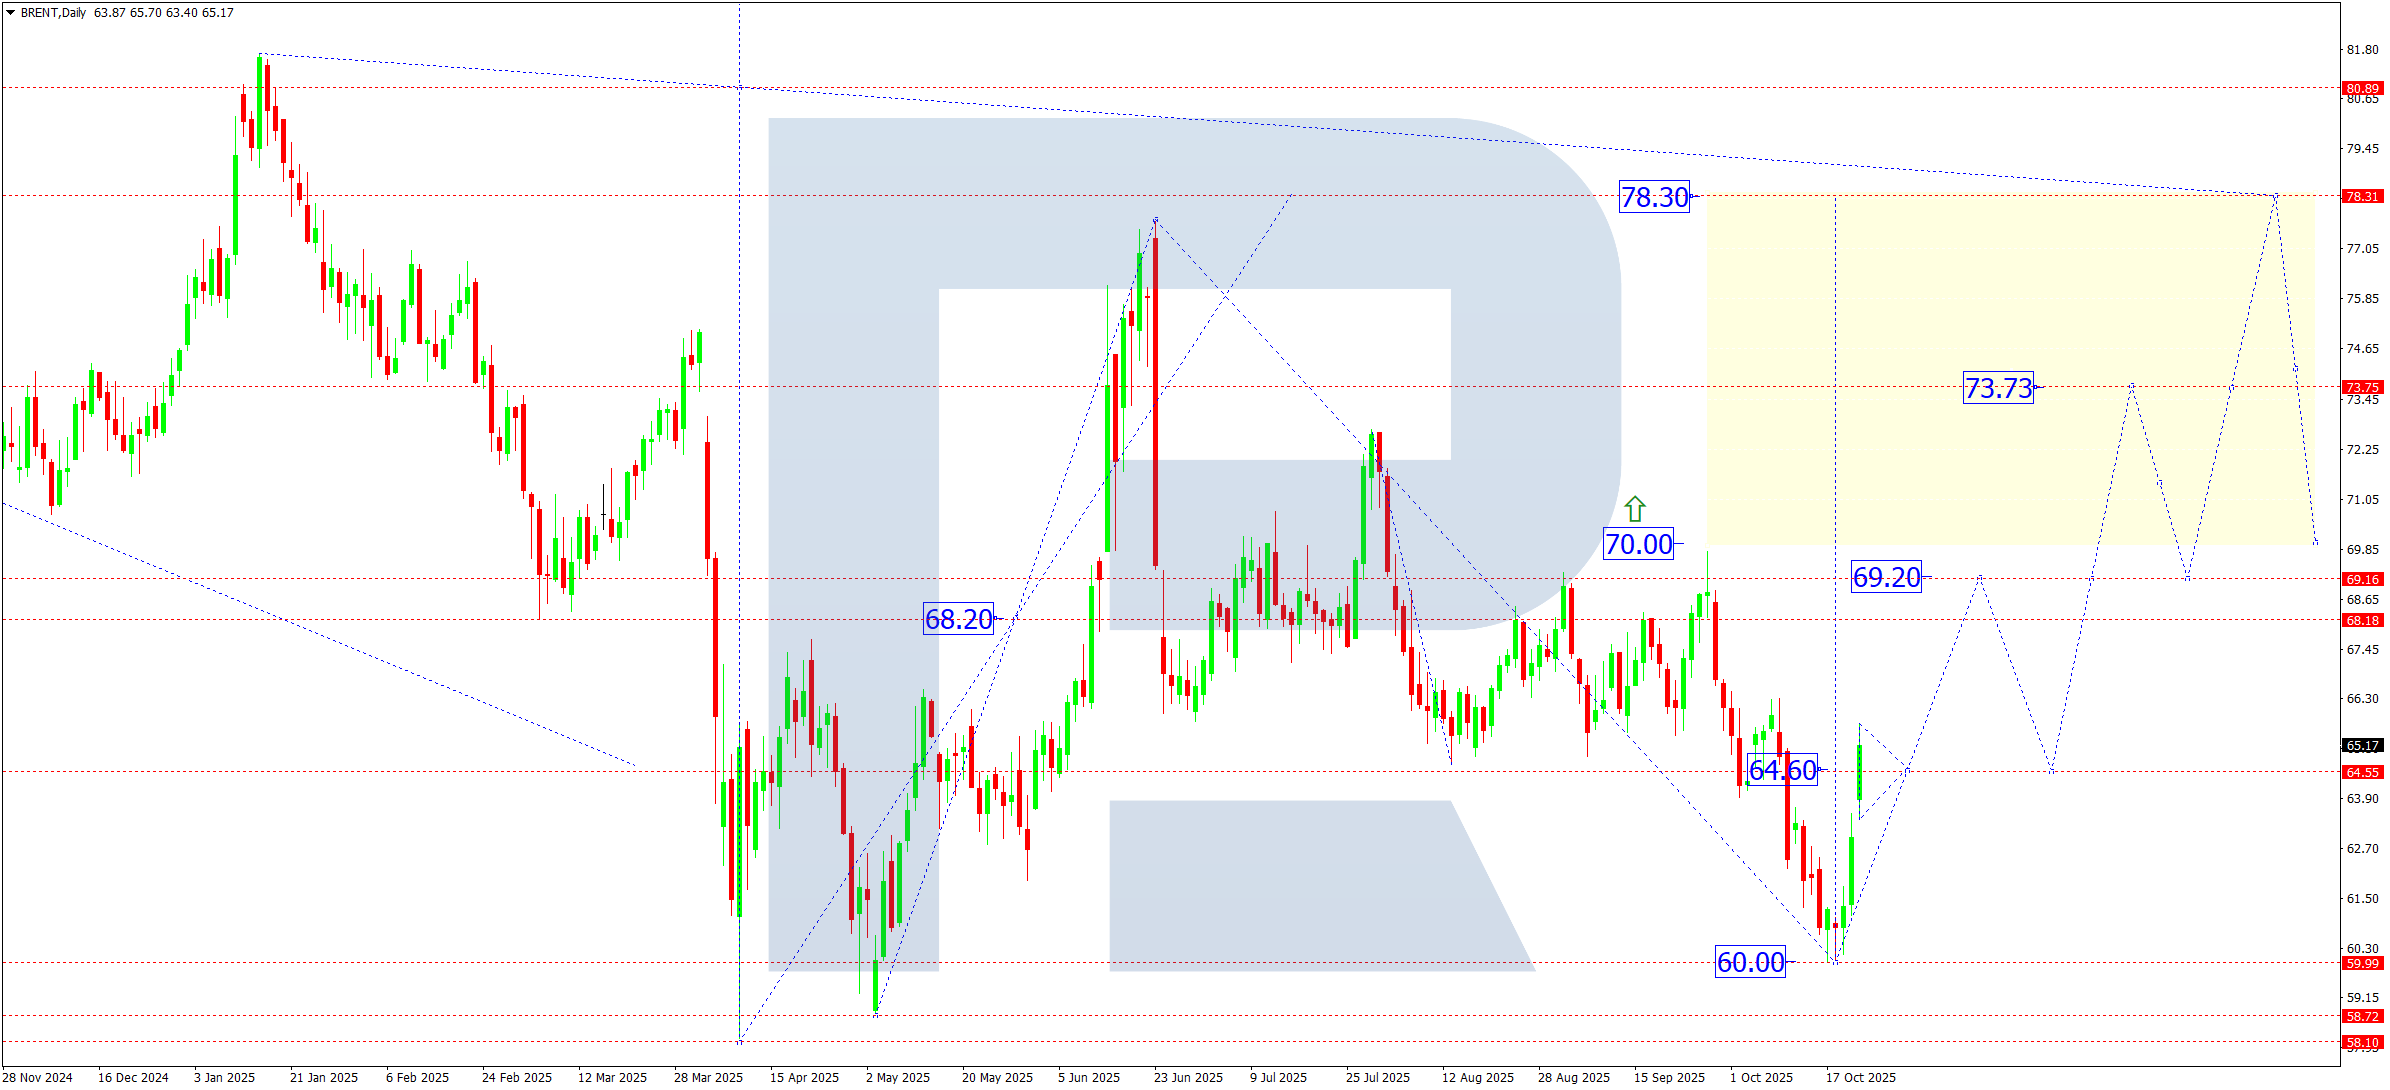
On the daily chart, Brent found support at 60.00 and built a reversal structure. A breakout above 64.60 followed by tight consolidation confirms the first structure of the fifth growth wave, with the nearest target at 69.20. After reaching it, a short-term pullback to 64.60 (retesting from above) is possible before the upward move resumes. A breakout above 69.20 will open the path to 73.73 and then 78.30, signalling a transition into an acceleration phase. In this case, a long-term trend towards 100–200 USD per barrel cannot be ruled out.
Brent forecast scenarios
Bullish (main) scenario: a rise from 64.60 with targets at 69.20, 73.73, and 78.30. Geopolitical risks, sanctions and instability among some producers create preconditions for a faster move into a higher price range.
Bearish (alternative, unlikely) scenario: a breakout below 64.60 with a local correction to 62.62 that does not change the broader bullish setup.


